
Mega Candles are Loading
186: The Weekly Selection

Introduction
Before we jump into this weeks work, I’d like to turn all your attention to the last two pieces of media I published:
Podcast: Dan and I talk all thinks markets in this 1-hour full table talk

Article: Much more in depth article than the Sunday newsletter

Overview
Broad market indexes up, leadership stocks down.
Just like last May, we are seeing leadership names deliver pullbacks while SPY continues to make new highs. This is pretty standard in a bull cycle, as I have described in detail in previous posts. The key is to take note of the stocks that lead out of the lows while they are leading and then track them as they most likely lead the indexes into a pullback. This prescient behavior is exactly what we want to see out of a great leadership stock, hence the title: leader, lol.
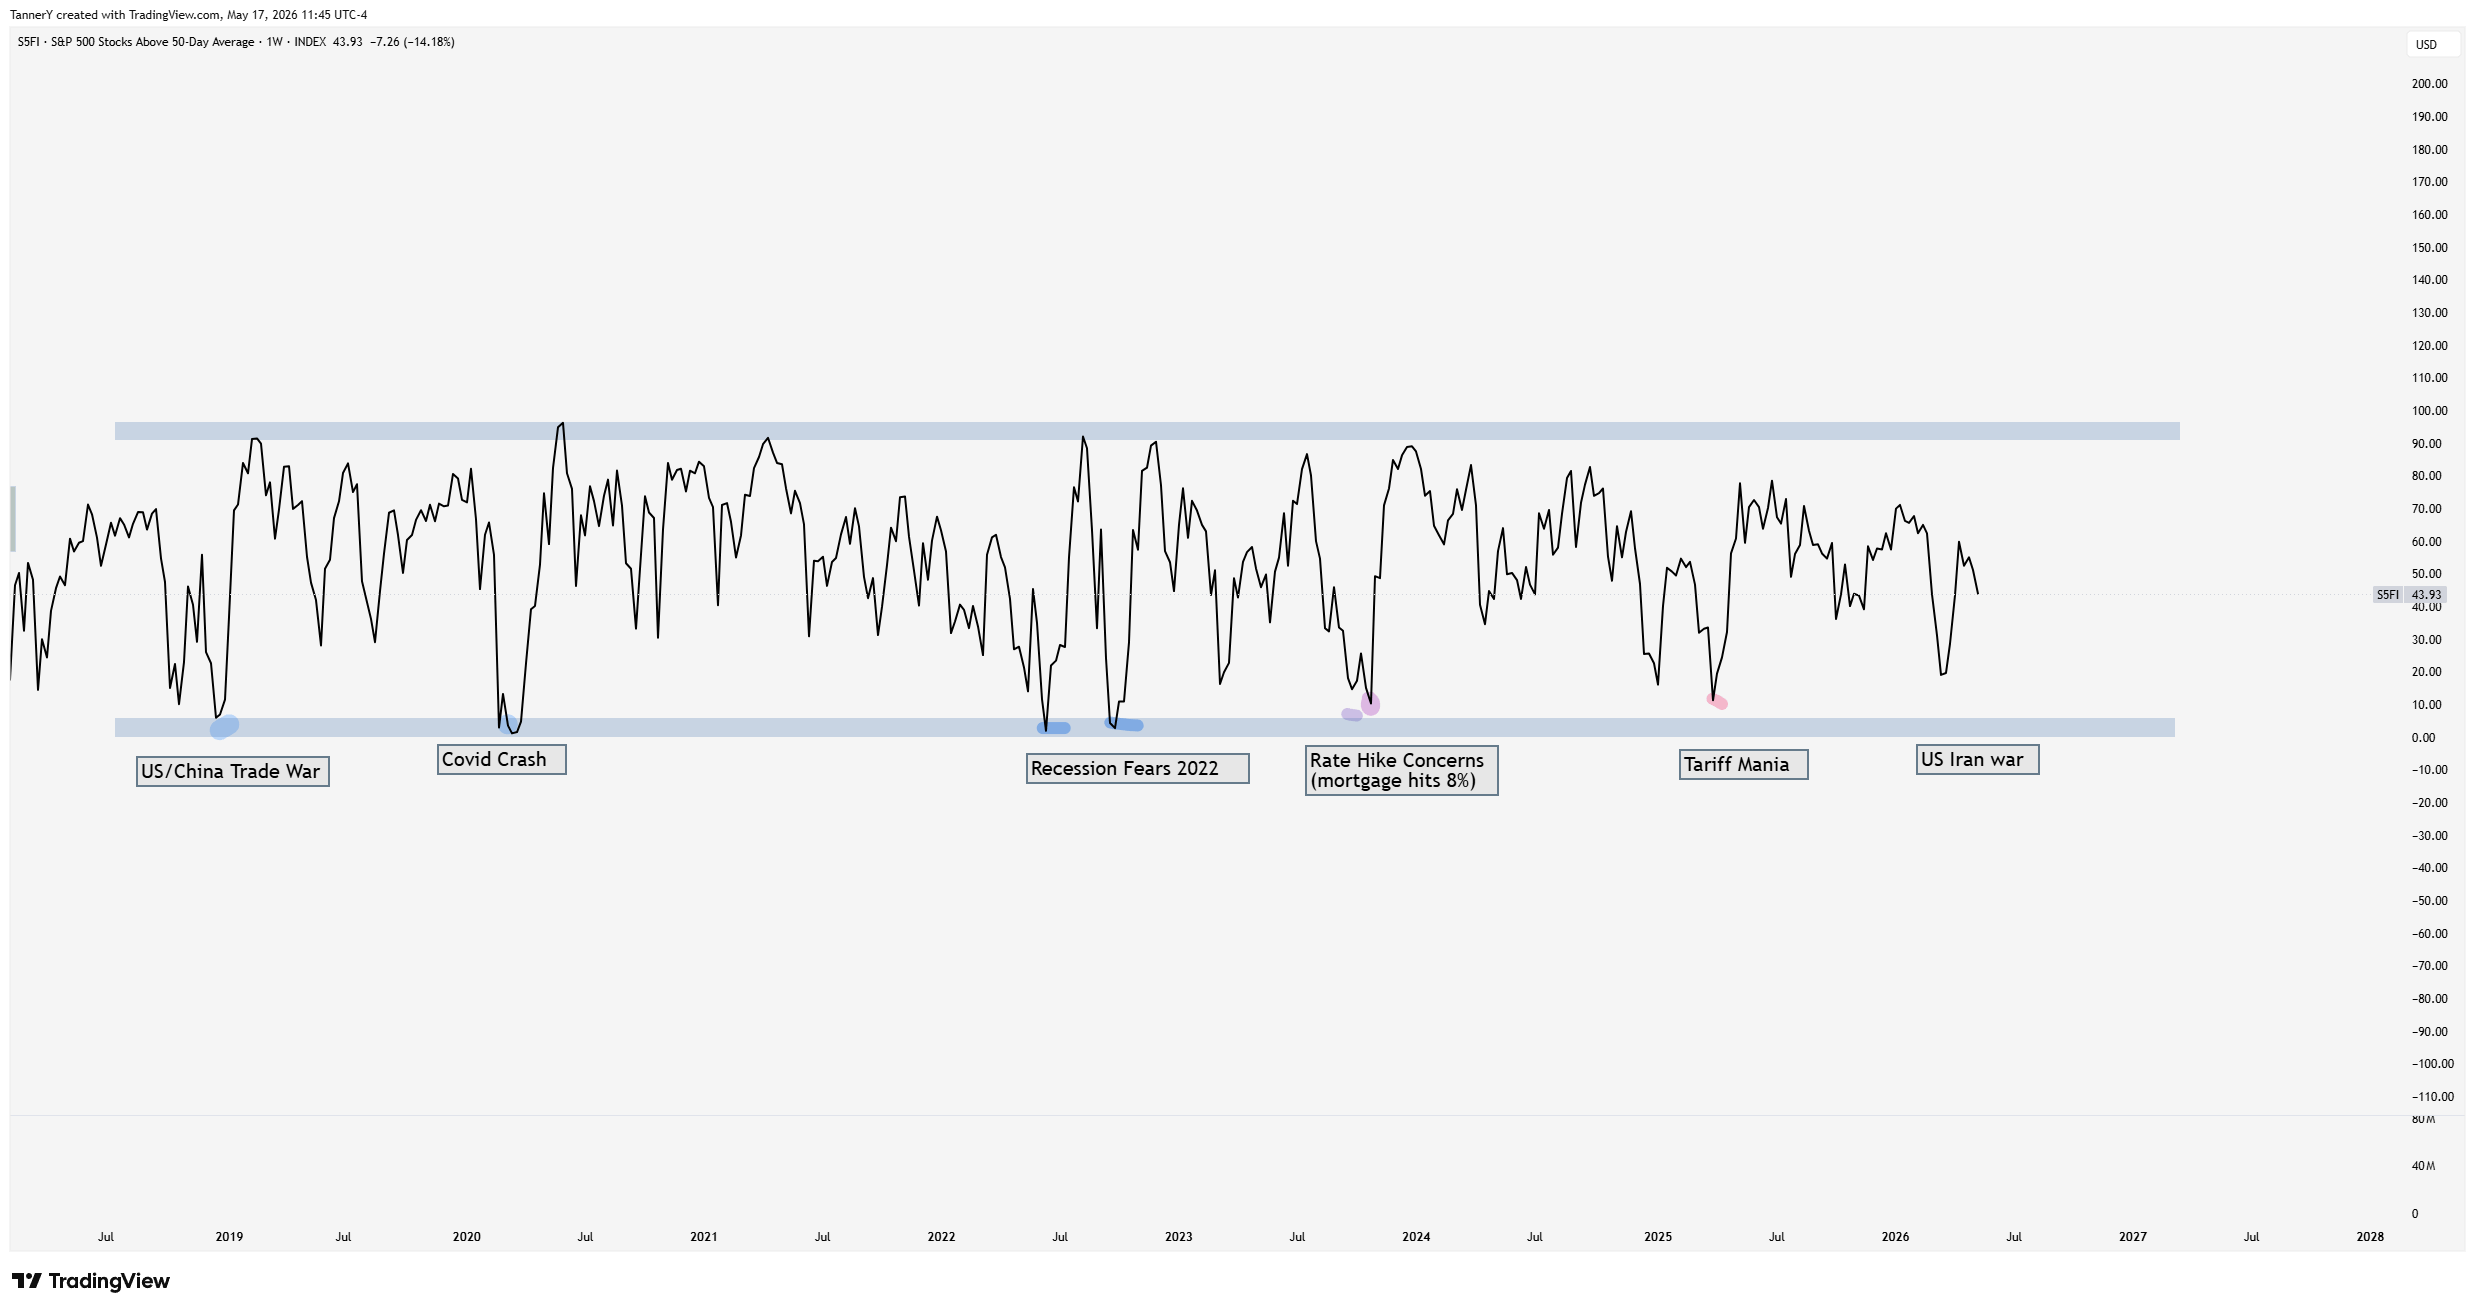
Observing the S5FI, we can see that stocks are slowly pulling in below the 50dsma. Notice how this gauge is not overheated. The market is highly focused right now, and this is not bearish. In fact, it goes to show that if we are truly seeing a bubble like event, this gauge would be running much hotter.
Speaking of SPY, earlier last week I shared my opinions on light volume SPY runs, the chart is as follows:

Since Inception:
- There are 13 instances where SPY reflects the current stretch
- The average return during these periods is 7.16%
- The largest gain was 20.71% (2009)
- The last 4 instances have all been within 1% of each other (around 9.5%)
- There were no negative data points
Many believe that we need overwhelming volume to indicate strength. While this is often true on individual names breaking out or power gapping, it is not the case for indexes. The data suggests that some of the best performance windows in the market come with light volume.
New Segment
This is not actually a new segment, but I wanted to quickly shed some light on what I am seeing outside of the investment community as it pertains to AI.
A girl I went to high school with posted a petition to cancel a TeraWulf ($WULF) datacenter project and to my surprise it has 14,000 signs and 1900 comments. There was not a single positive comment there or in the town hall meeting, and this tells me a few things:
1) Most of my peers are like me in drive and ambition in life. Technology to them is paramount to success. This puts me in an echo chamber of like mindedness that can make me think that AI is widely accepted, when there are still clearly plenty out there that are not.
2) There are still a ton of non believers or copers. Shooting down projects because they're either afraid of being replaced or not accepting their future. Either way, the cat is out of the bag and its not going back in.
When I see things like this it helps reground me that we are early in this technology, and the investment potential is still massive.
Looking Forward
As I mentioned, Leadership groups are pulling back. Memory and Semis, which ran the hottest out of March lows are now the first to revisit their 10sma. The way I track this is DRAM and SOXX, the ETFs for each of the groups. From there, I go into the holdings of these ETFs to see which are the strongest. To do this:
Simply input the ETF name into an LLM and have it pull “top 10 holdings”
Then, go chart by chart and measure the % off highs or relationship with the 10SMA
From there, track the top 1 or 2
I do not want 100 names on my watchlist. This is an extremely focused market and there is no reason to be watching so many names from each theme. If you are a technical analysis only trader, you should be focused on the absolutely strongest only. No big bases right now.
I bought SNDK this past week in the subscriber stack, lets take a look at how I arrived there:
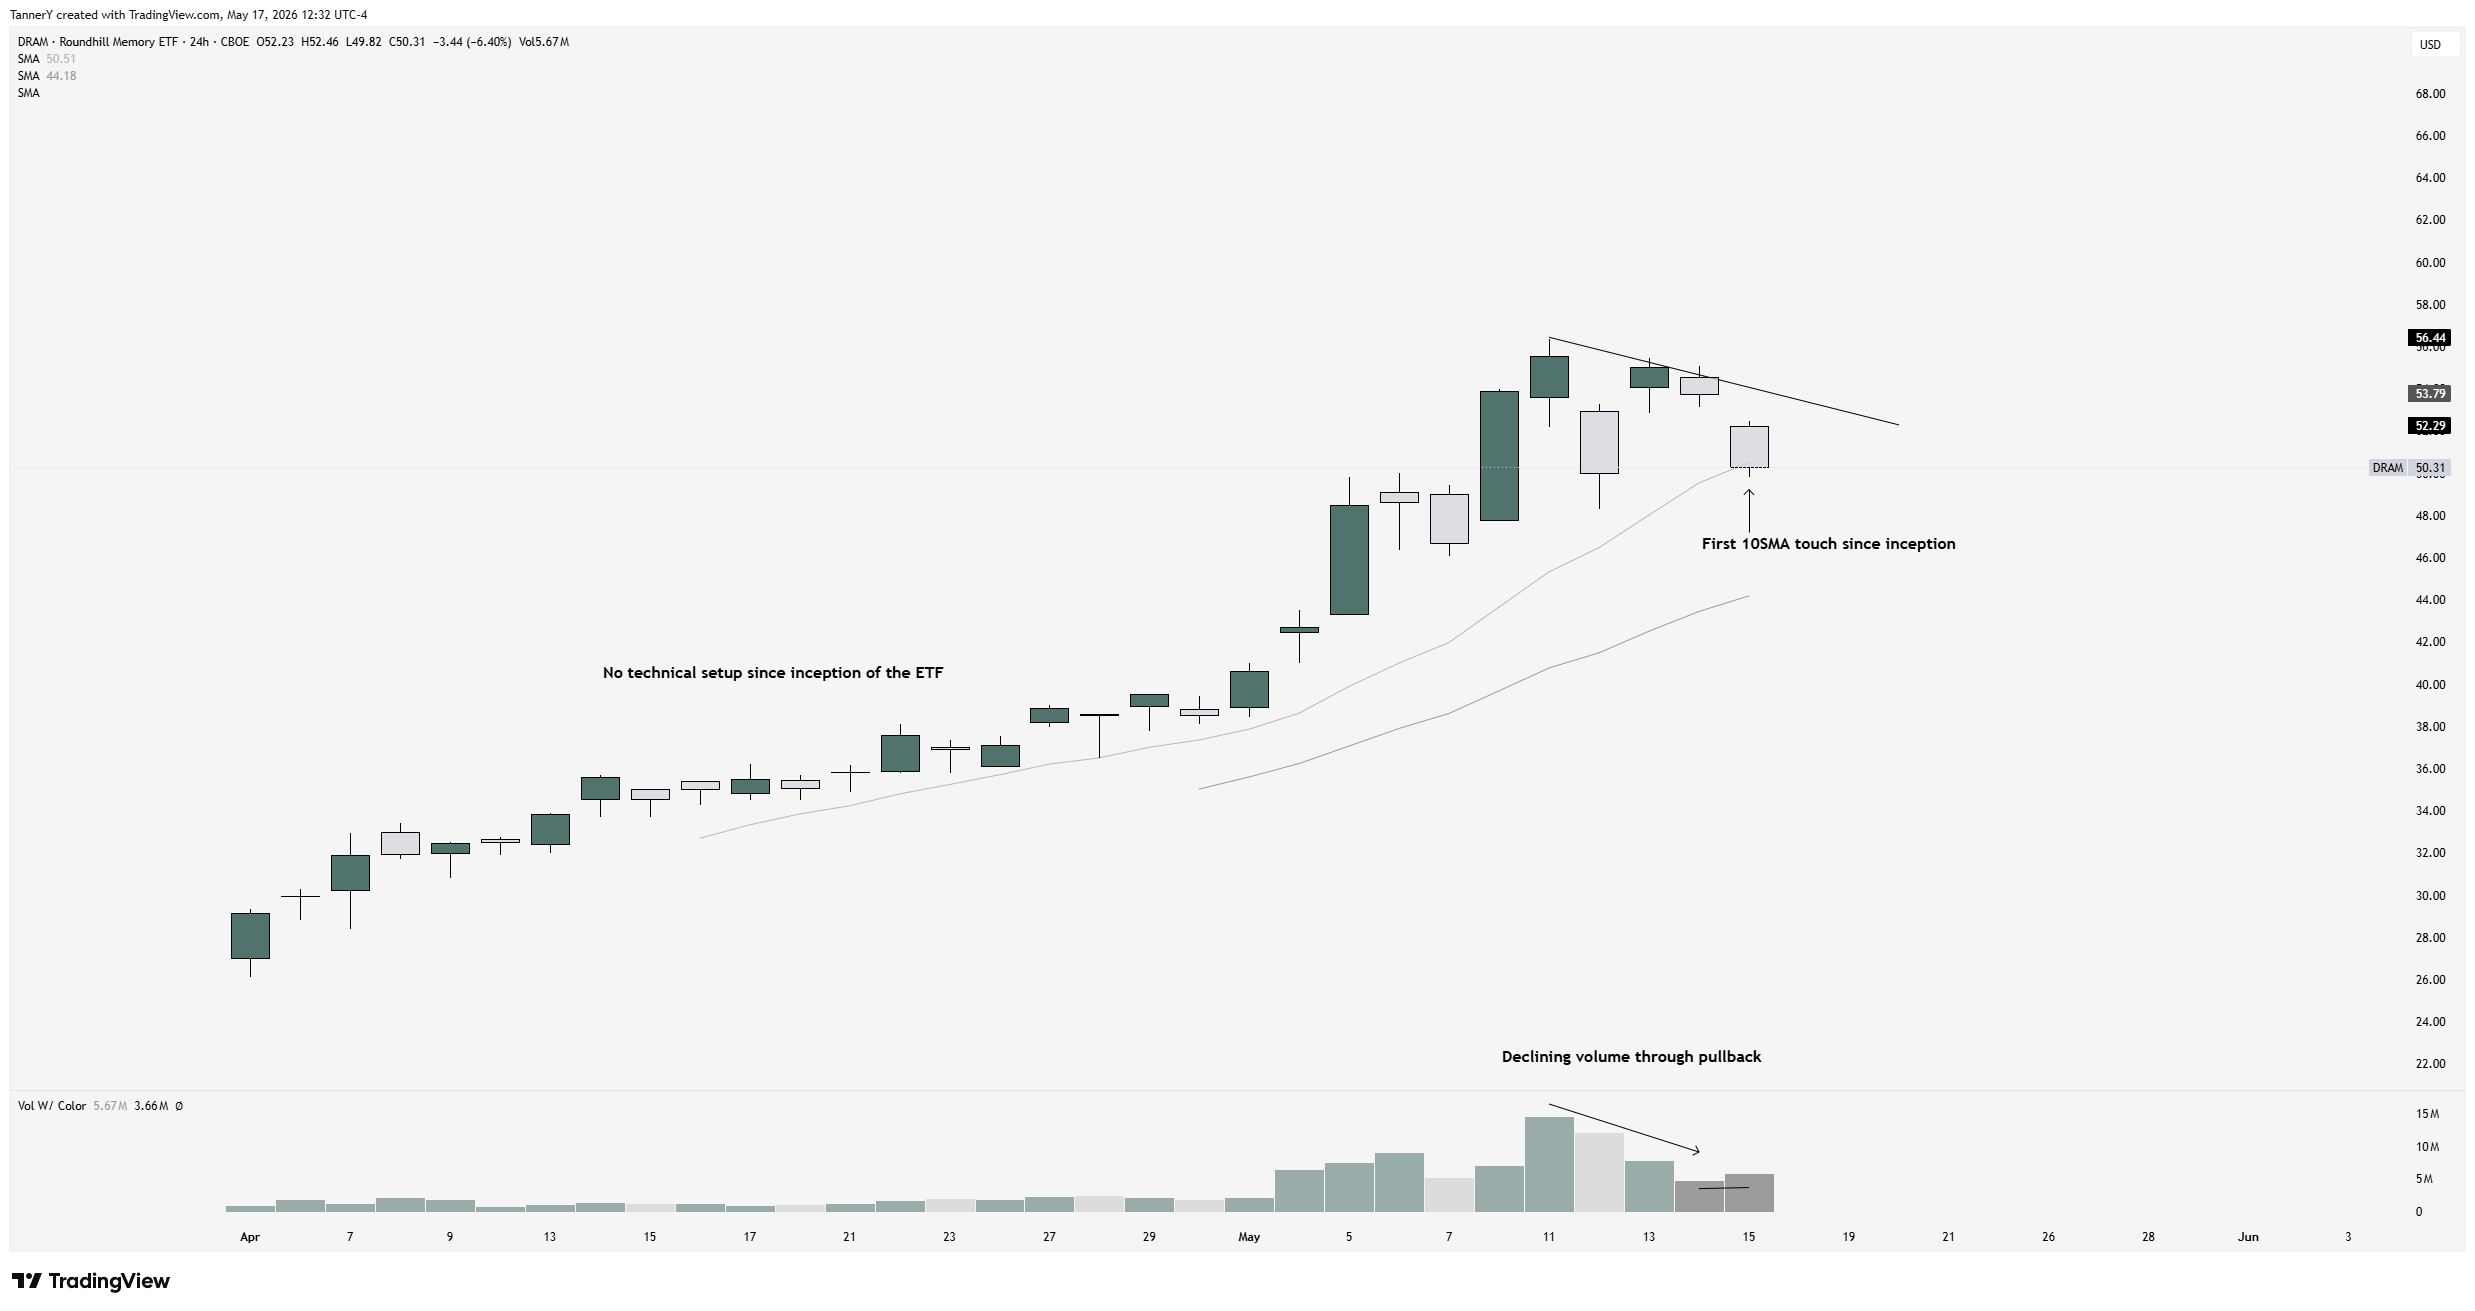
First, taking a look at the memory ETF we can see the first sma touch since inception. Ideally, we see this group spend another day here to setup a launch pad to move higher. Once I noticed this, I went into the holdings:
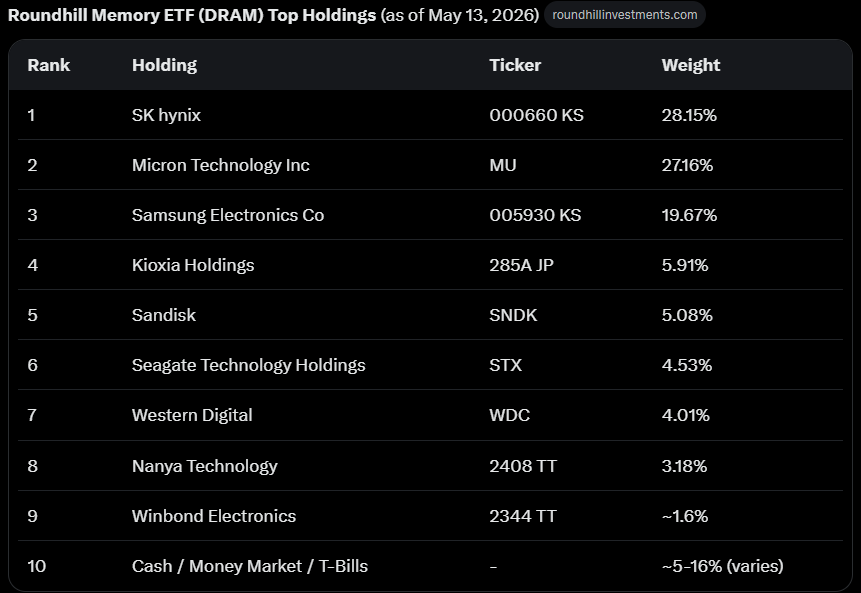
Seeing as these top 10 holdings mostly foreign, we can immediately discount those and focus on the primary US based stocks: MU SNDK STX WDC.
Once we have our list, I’ll make a quick watchlist in TradingView and look at each chart to identify:
Strongest move off the lows
Smallest % off the highs
Respect of the local SMA (10 in this case)
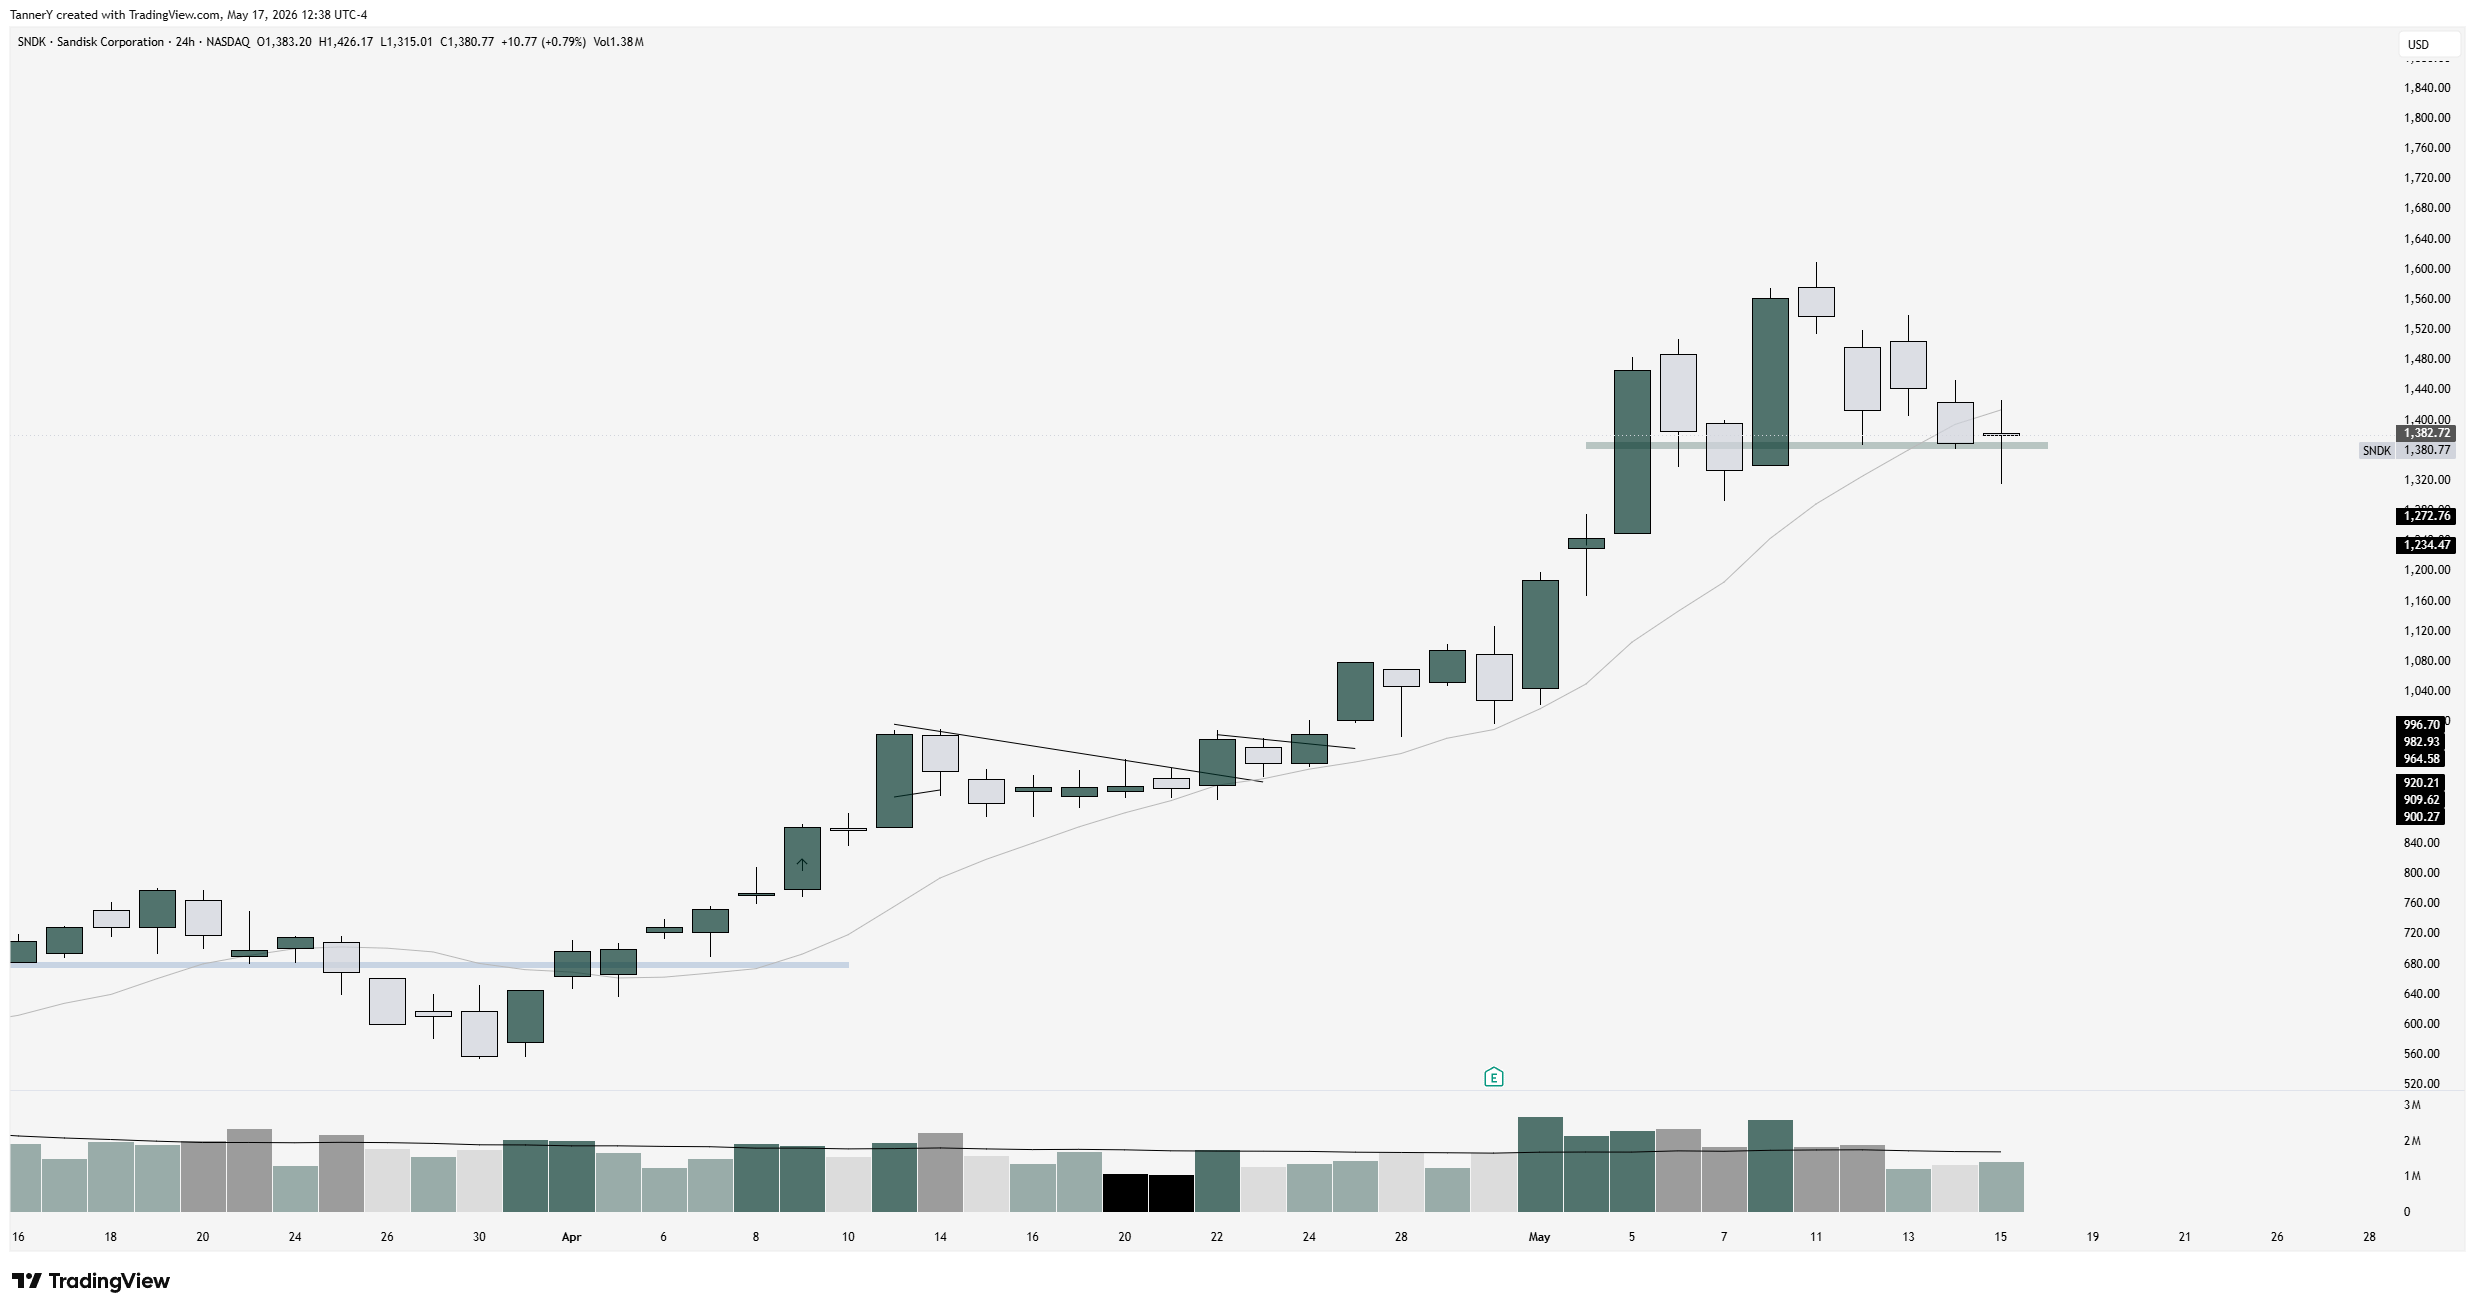
As we can see, this chart is not only cleaner than the DRAM chart, but also in the name that has been the strongest in the group. This is signaling that if the entire group is going higher, SNDK will lead. That is the one I want to own.
This simple process is 5 minutes per theme. You should be doing this every night if you have open capital in your book in a market like this. I cannot recommend it enough.
Look forward to more articles this week as I hone in on new positions. Pay attention to your stops and do not betray them. See you in the next one!