
Has The Market Gone Parabolic?
185: The Weekly Selection

Introduction
Hello and welcome in to another iteration of The Weekly Selection, where I discuss my thoughts on the market, where its coming from and where its headed.
These last few months have been some of the most exciting I’ve ever seen in my career. From the mislead pessimism sinking the market 10% in March, to a swift reclamation of highs after Trump announced a ceasefire, we really have seen “it all” before even making it to the halfway point of 2026. Something i mentioned earlier this year was the fear of “midterms” and how historically midterm years are choppy for markets. In my coverage, I stated:
When it comes to seasonality, I am usually a subscriber. With over 100 years of data we can make some assumptions about price action during periods of historical cooling/heating. That said, at every turn over the last 3 years we have been wrong about seasonality. None of these market killers came to pass, so who’s to say that a midterm year will kill it now?
With the market surging back to highs, I think its fair to say that seasonality bros were once again, wrong. Speaking of markets going back to highs, lets take a look at some charts.
Indexes
Starting off with SPY, which we can see making an eerily similar move to what it did in late 2023, where a strong turnaround through earnings season sparked a rally that quickly went to highs, and then continued in a lockout fashion for weeks.
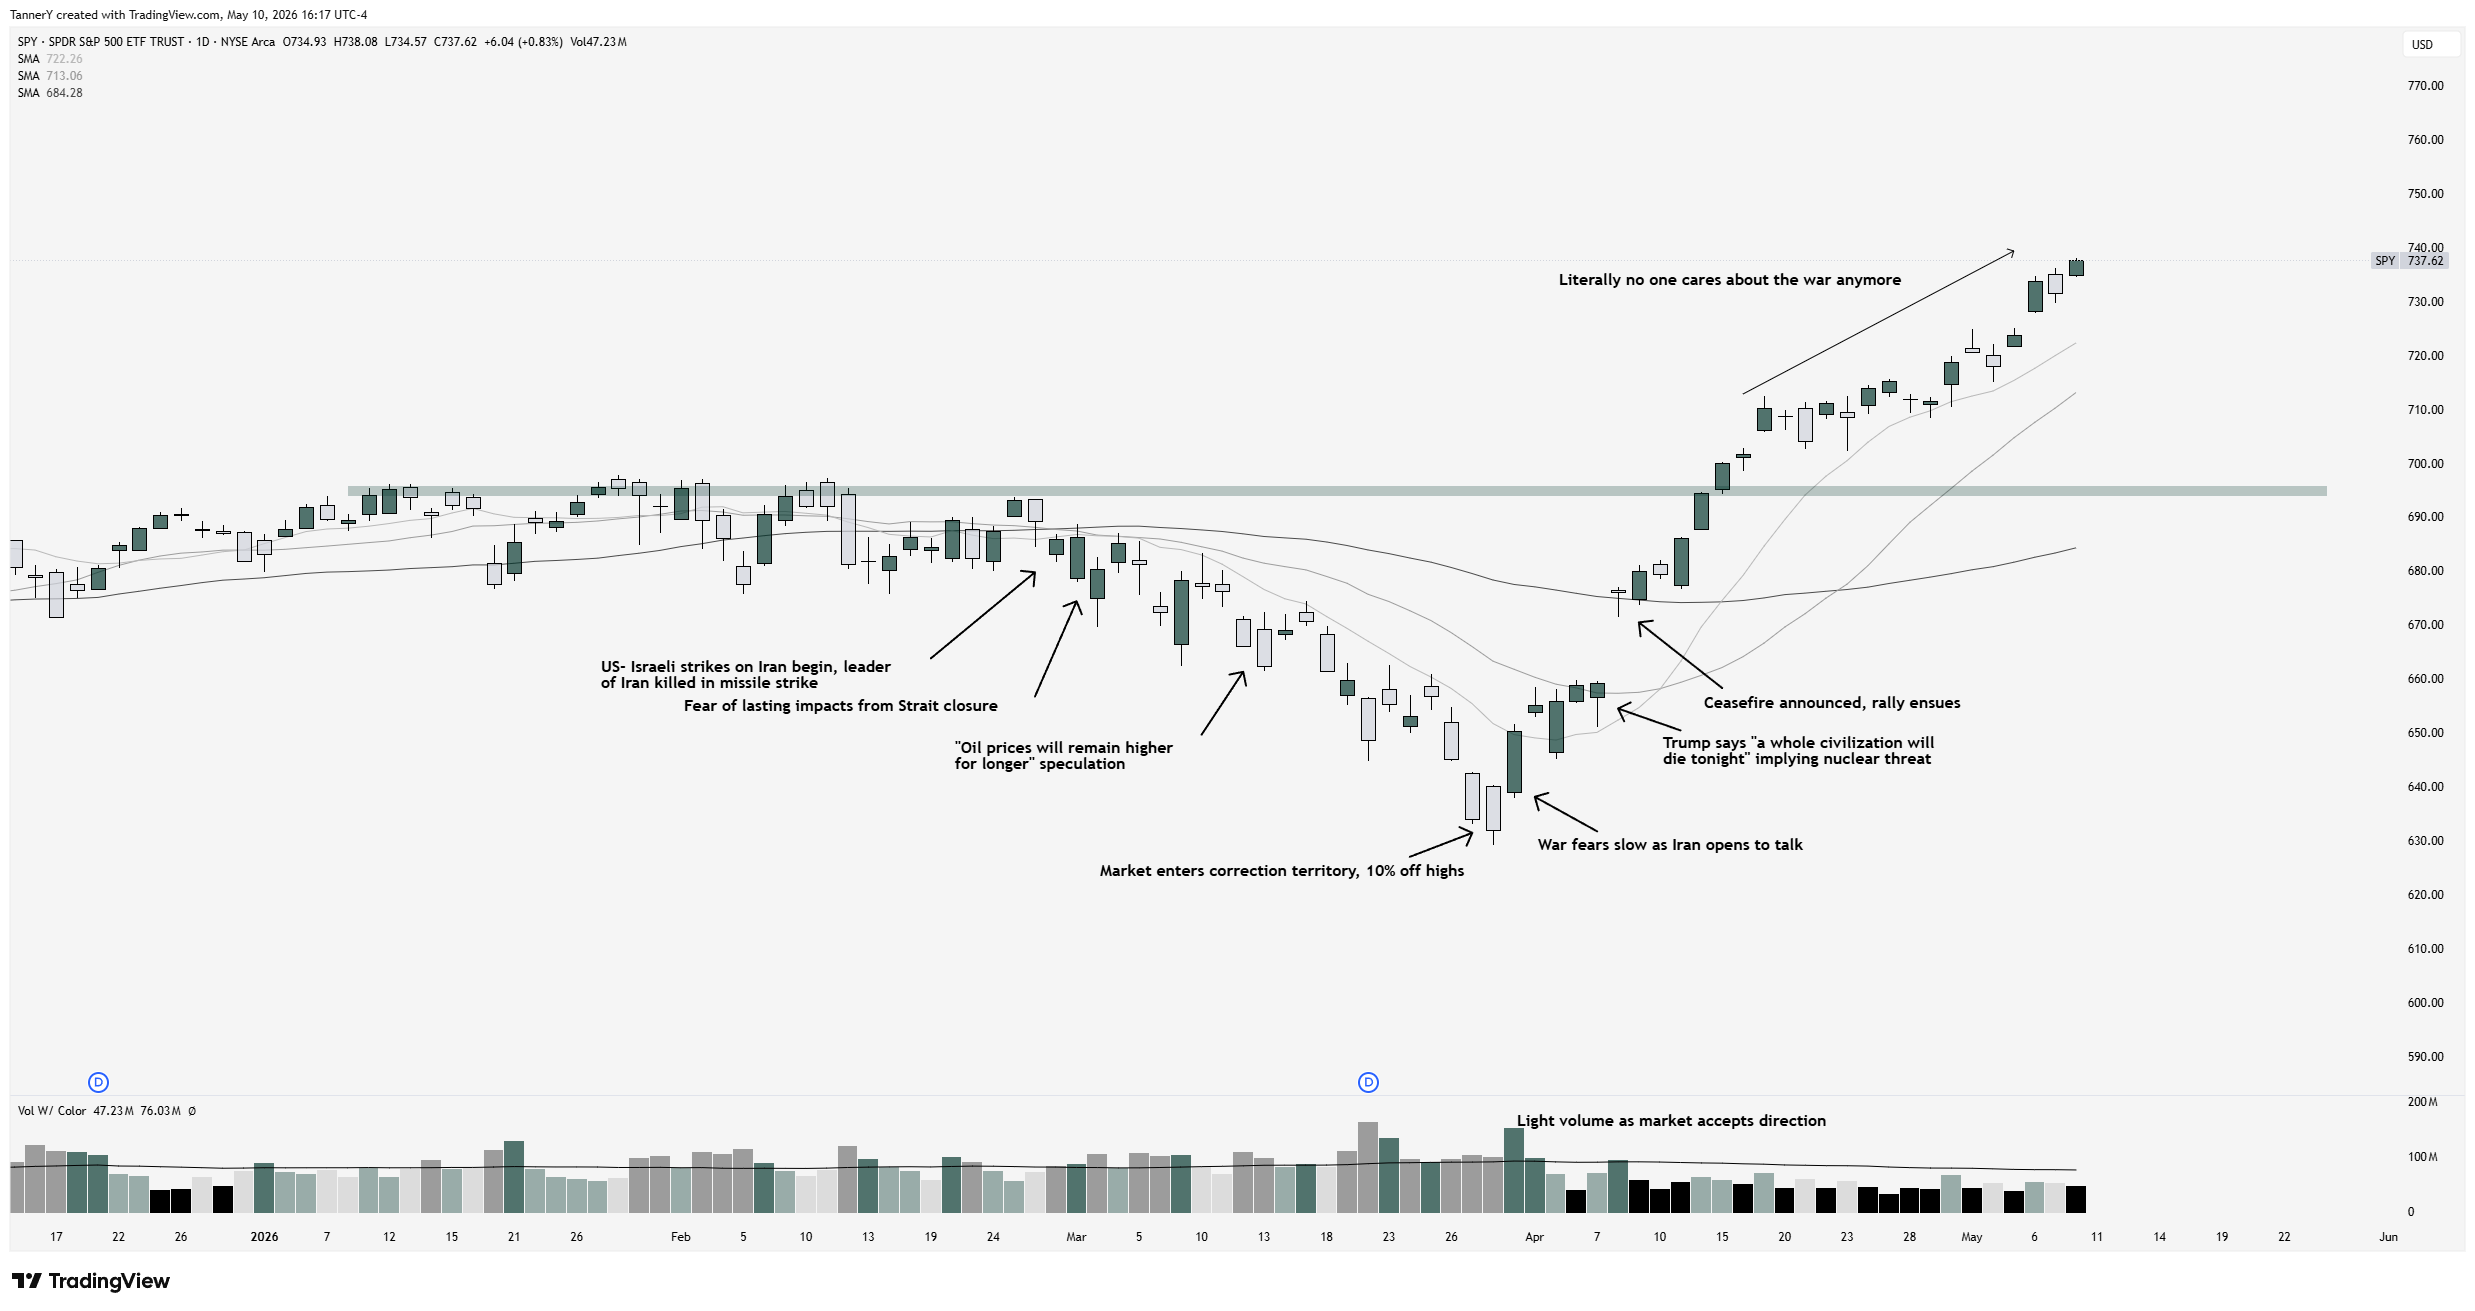
If you missed it, I discussed this similar setup a few weeks ago in this article:

Seeing SPY perform well without mentioning SOXX would be a crime, so lets take a look at the strongest component industry of the index below:
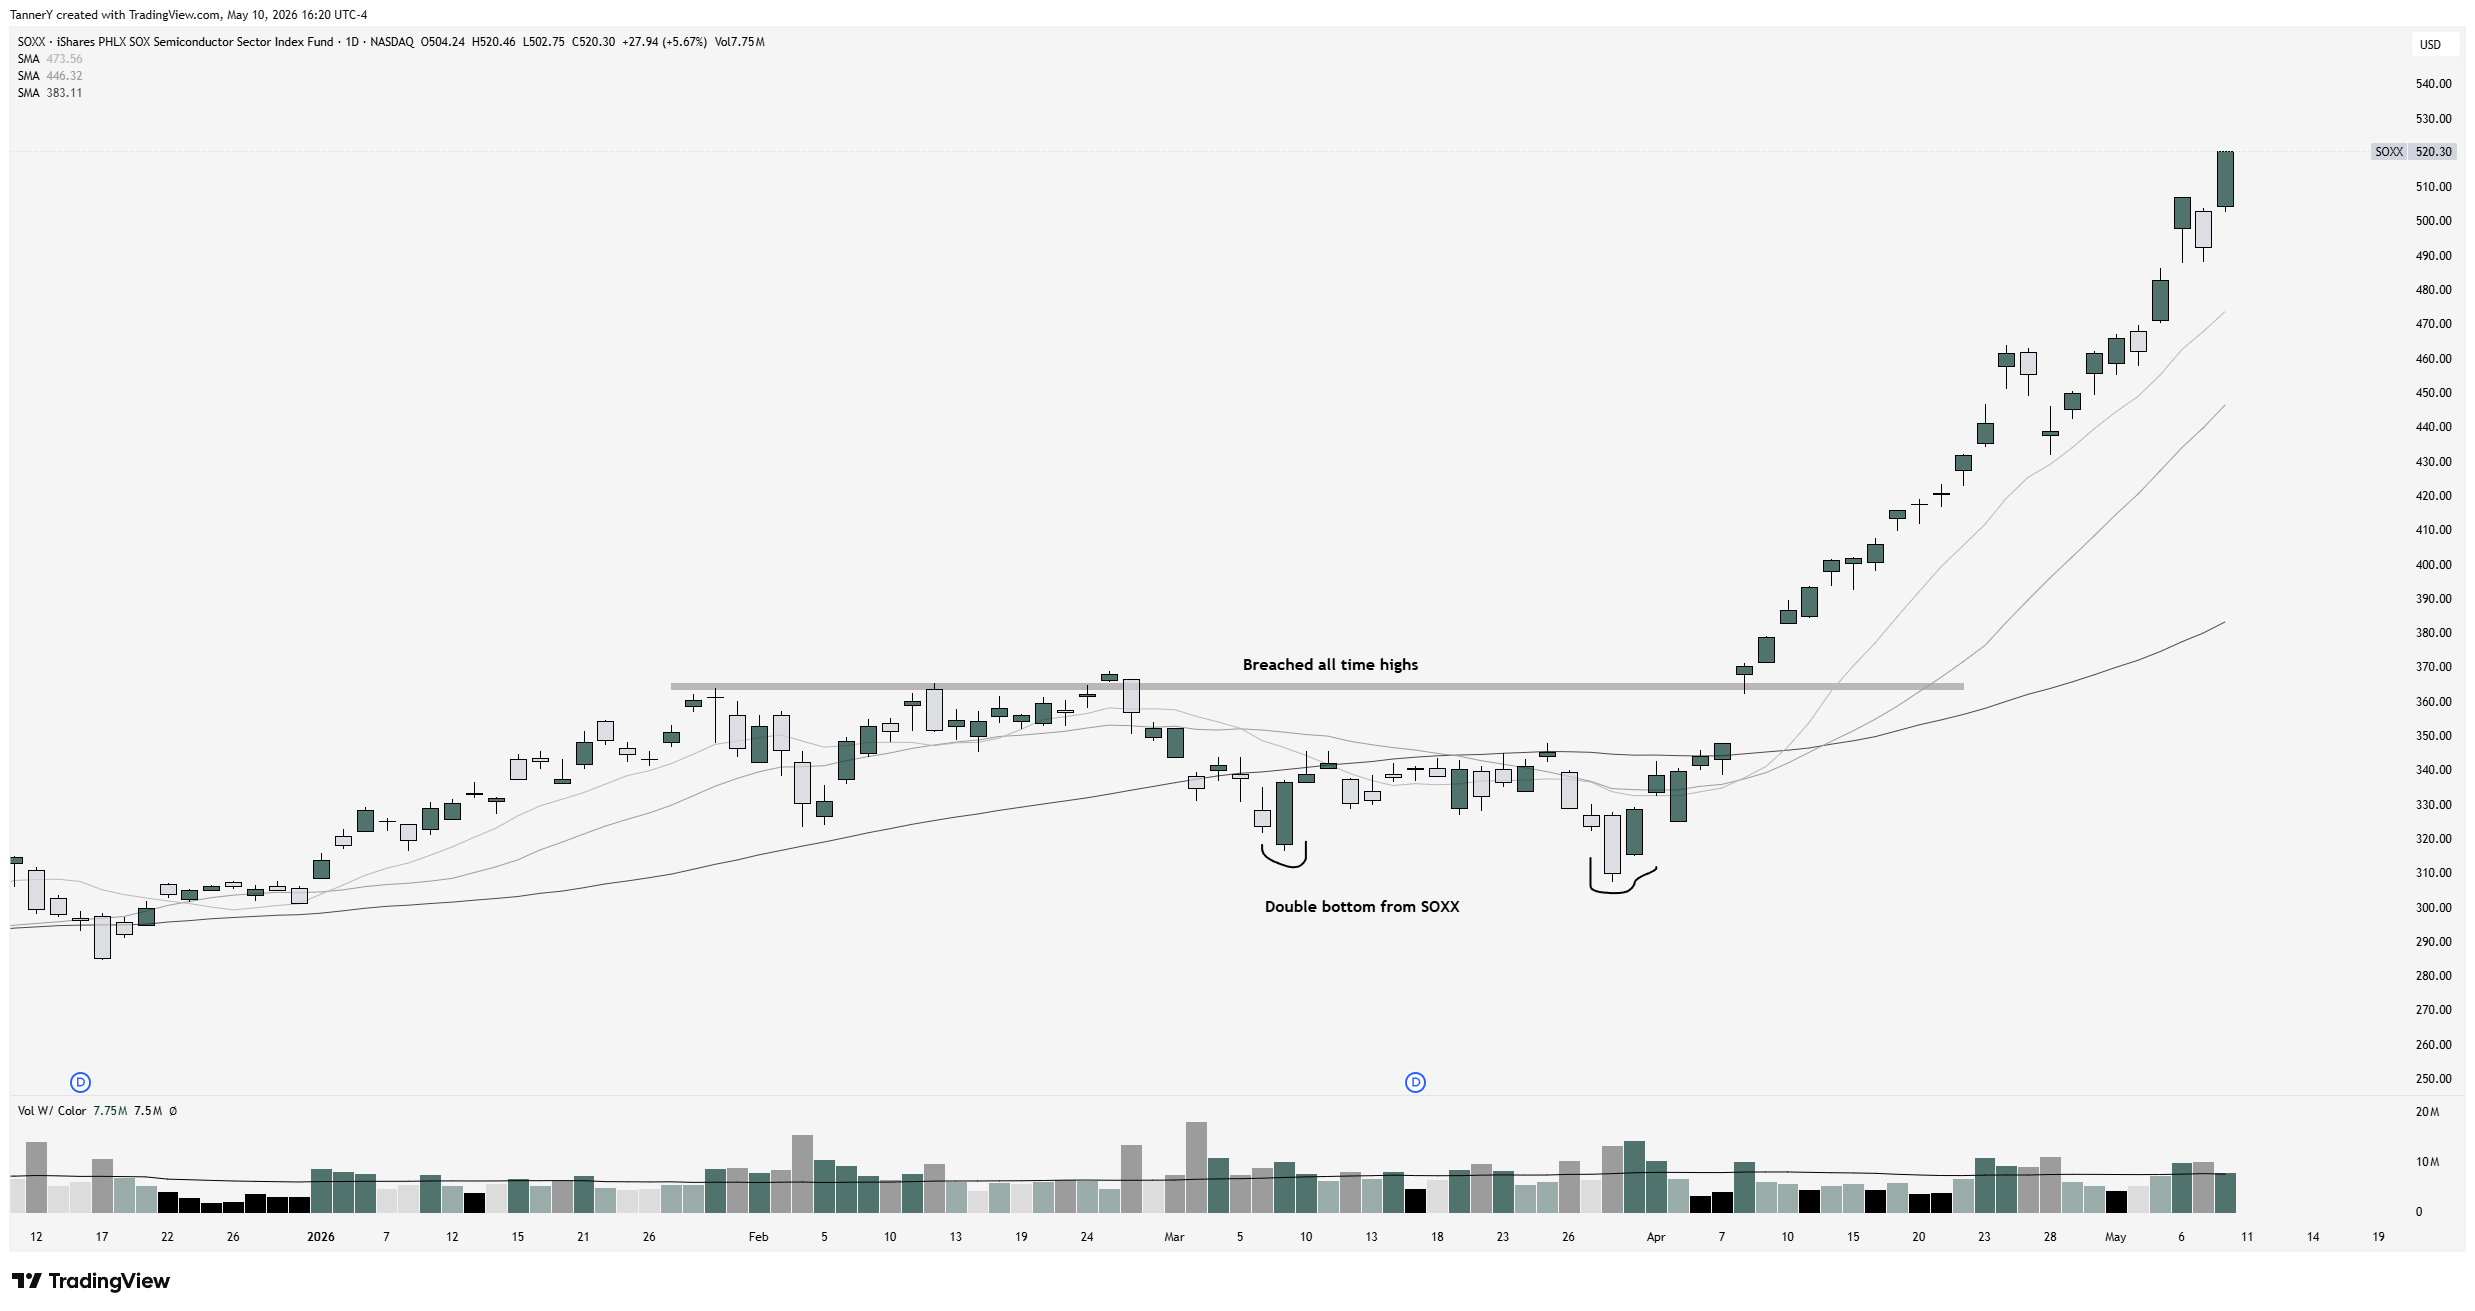
This is truly unbelievable. INTC has gone totally parabolic, and the industry group is on a mission to mars. I believe this chart is in a blowoff top acceleration, and it will present a parabolic short in the coming weeks. We must be prepared for this, and I will have an article ready for it when it comes.
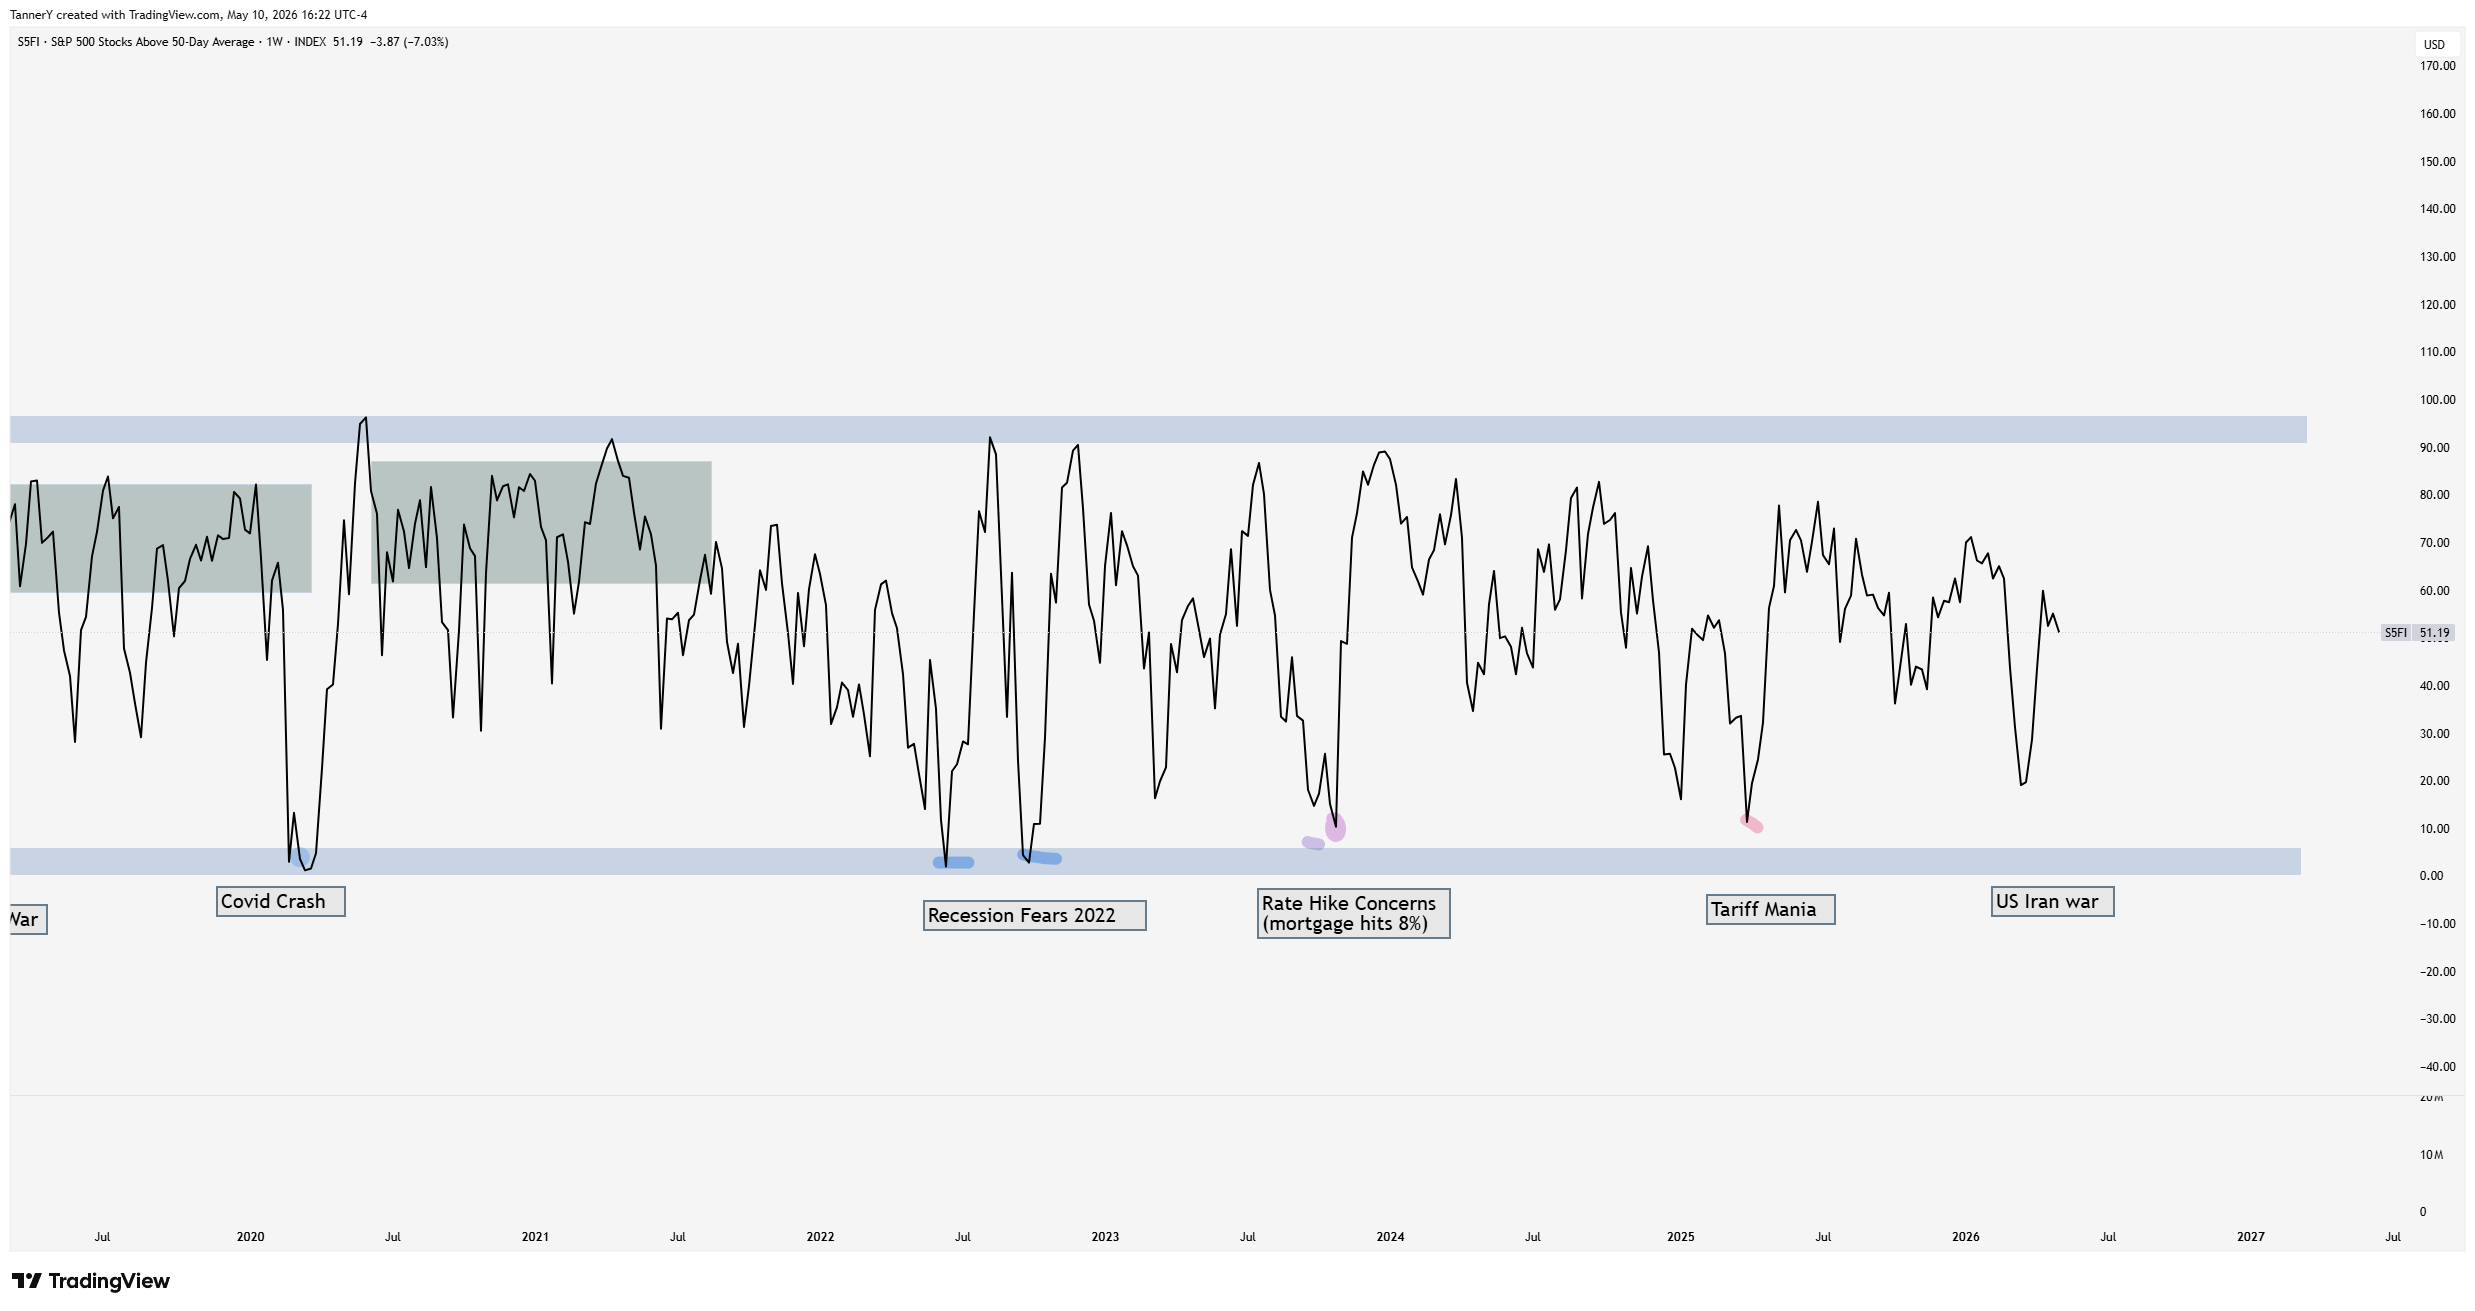
The S5FI is not overheated at all either, suggesting there is room higher on indexes, likely when we get true rotation into other market components, like value and adjacent datacenter groups.
Parabolic Trend Analysis
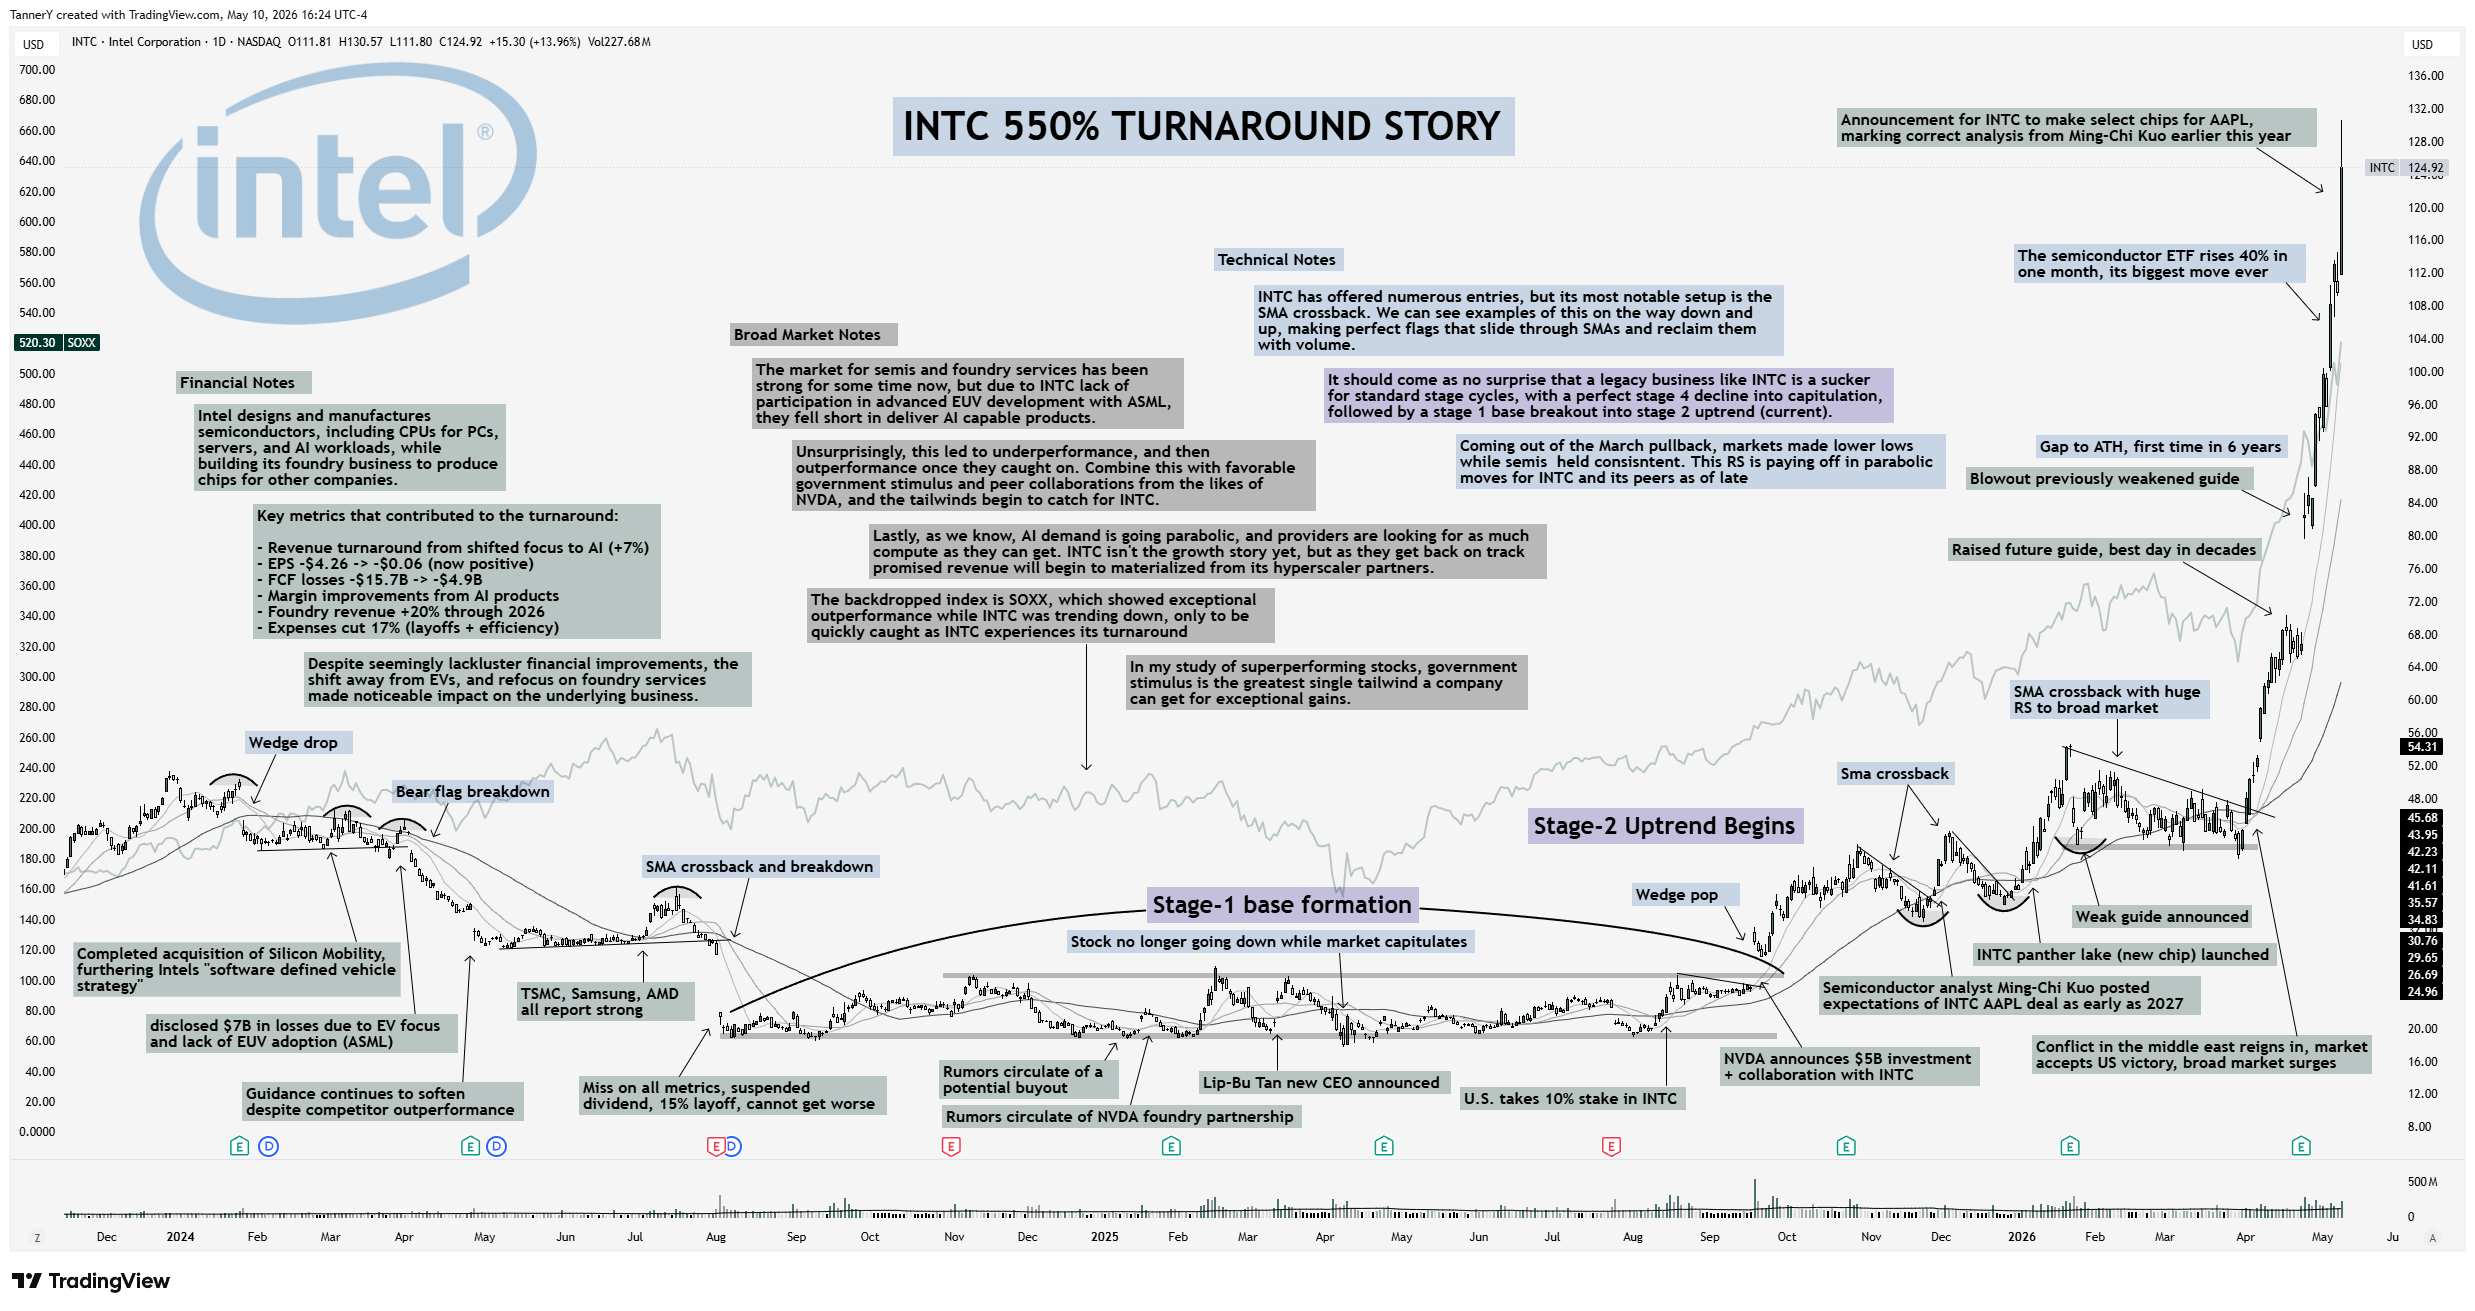
Speaking of SOXX and INTC, I have taken the time to prepare the trend analysis for this stock and the turnaround it has underwent in the last few years. As we can see, INTC was heavily focused on electric vehicles and outsourced chip development in 2024, something that proved to be a bad bet as EUV machinery breakthroughs for AI chips were prevalent in 2025. With the help of the government, new CEO Lip-Bu Tan, and an investment from NVDA, the turnaround has been swift, surging over 500% in just under a year.
This should come as no surprise to long time readers, as we know from the study of hundreds of parabolic charts:
“Stocks that get government help see much more ferocious and swift parabolic trends than those that do not”.
Looking Forward
Having a look at the week ahead, I wanted to first share my portfolio, then get into some of the key ideas I am watching.
As it stands, my portfolio in order of holdings by size is as follows:
GEV
VRT
CAT
PL
AAOI
ARM
RKLB
KRKNF
Of these, ARM and KRKNF are susceptible to be sold this week, as both are about to either breakdown below entry (KRKNF) or are slipping a trialing SMA that I wanted it to hold (ARM). In the case of ARM, I am also not keen on the price action given its indexes strength. The breakout to highs is strong, and I may re enter, but for now, I’d rather free up the capital for a higher conviction trade.
Speaking of which, lets get into some ideas:
SNDK short. If this idea presents an opportunity this week, I leave you with the chart of SNDK, and the charts of SMCI and MSTR. MSTR was a parabolic short I capitalized on in 2024, and I’d do it again if the setup presents itself. See below:
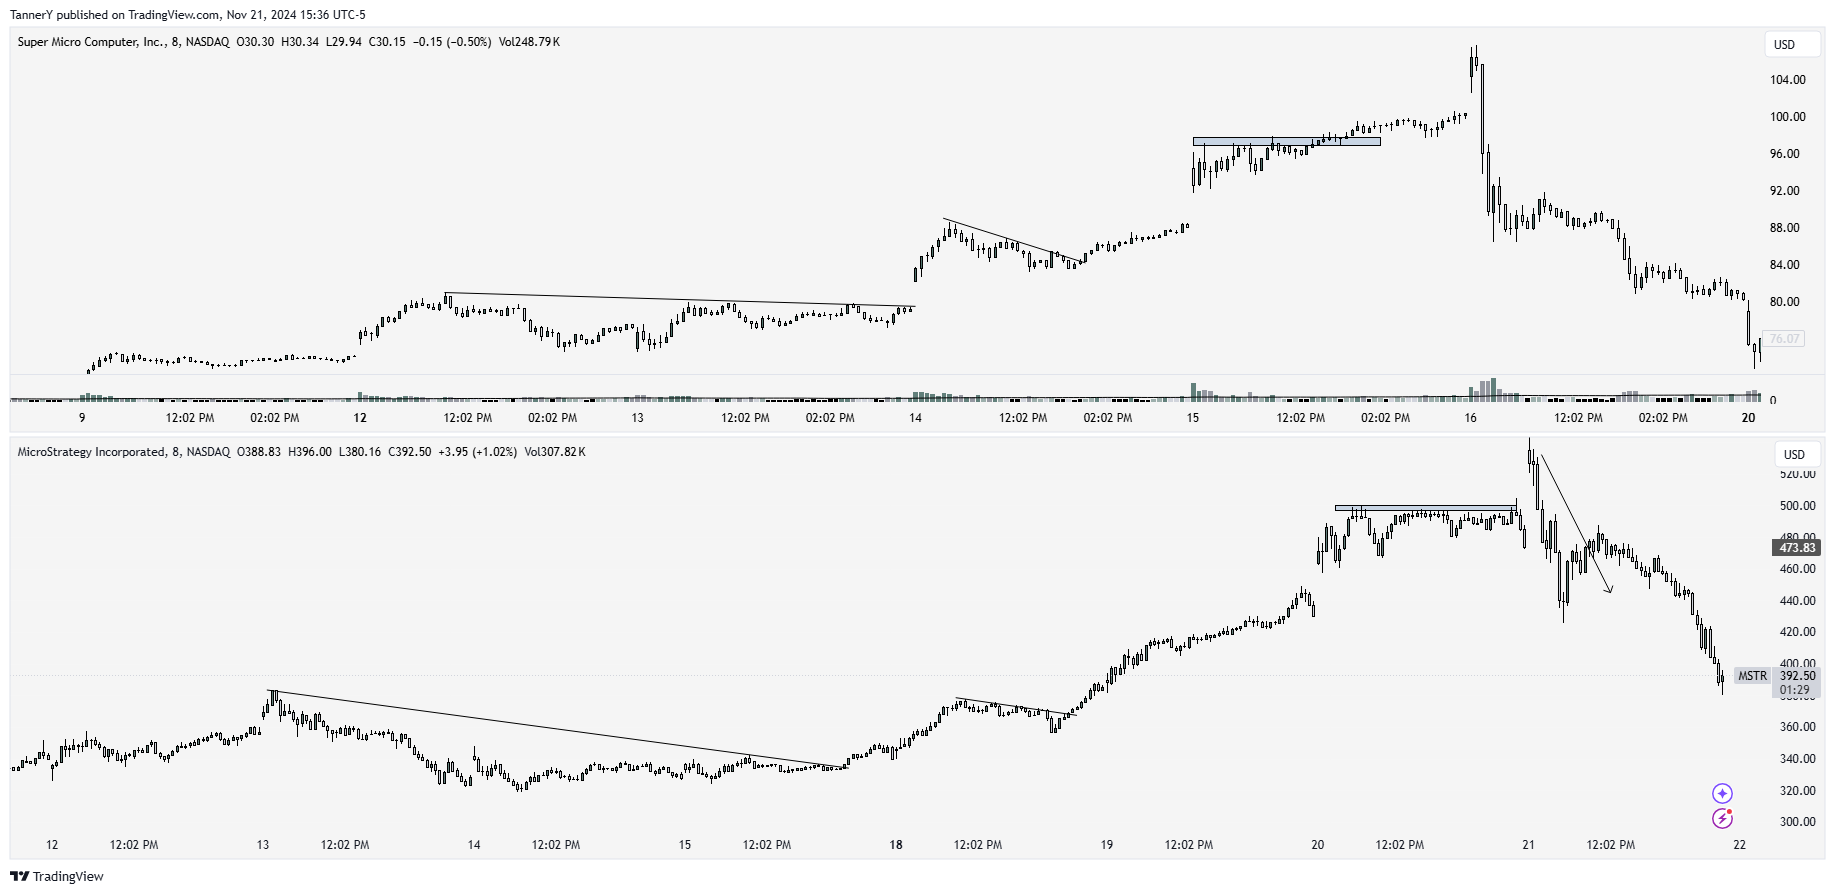
We will go over this chart in detail this week in my piece about shorting parabolic charts.
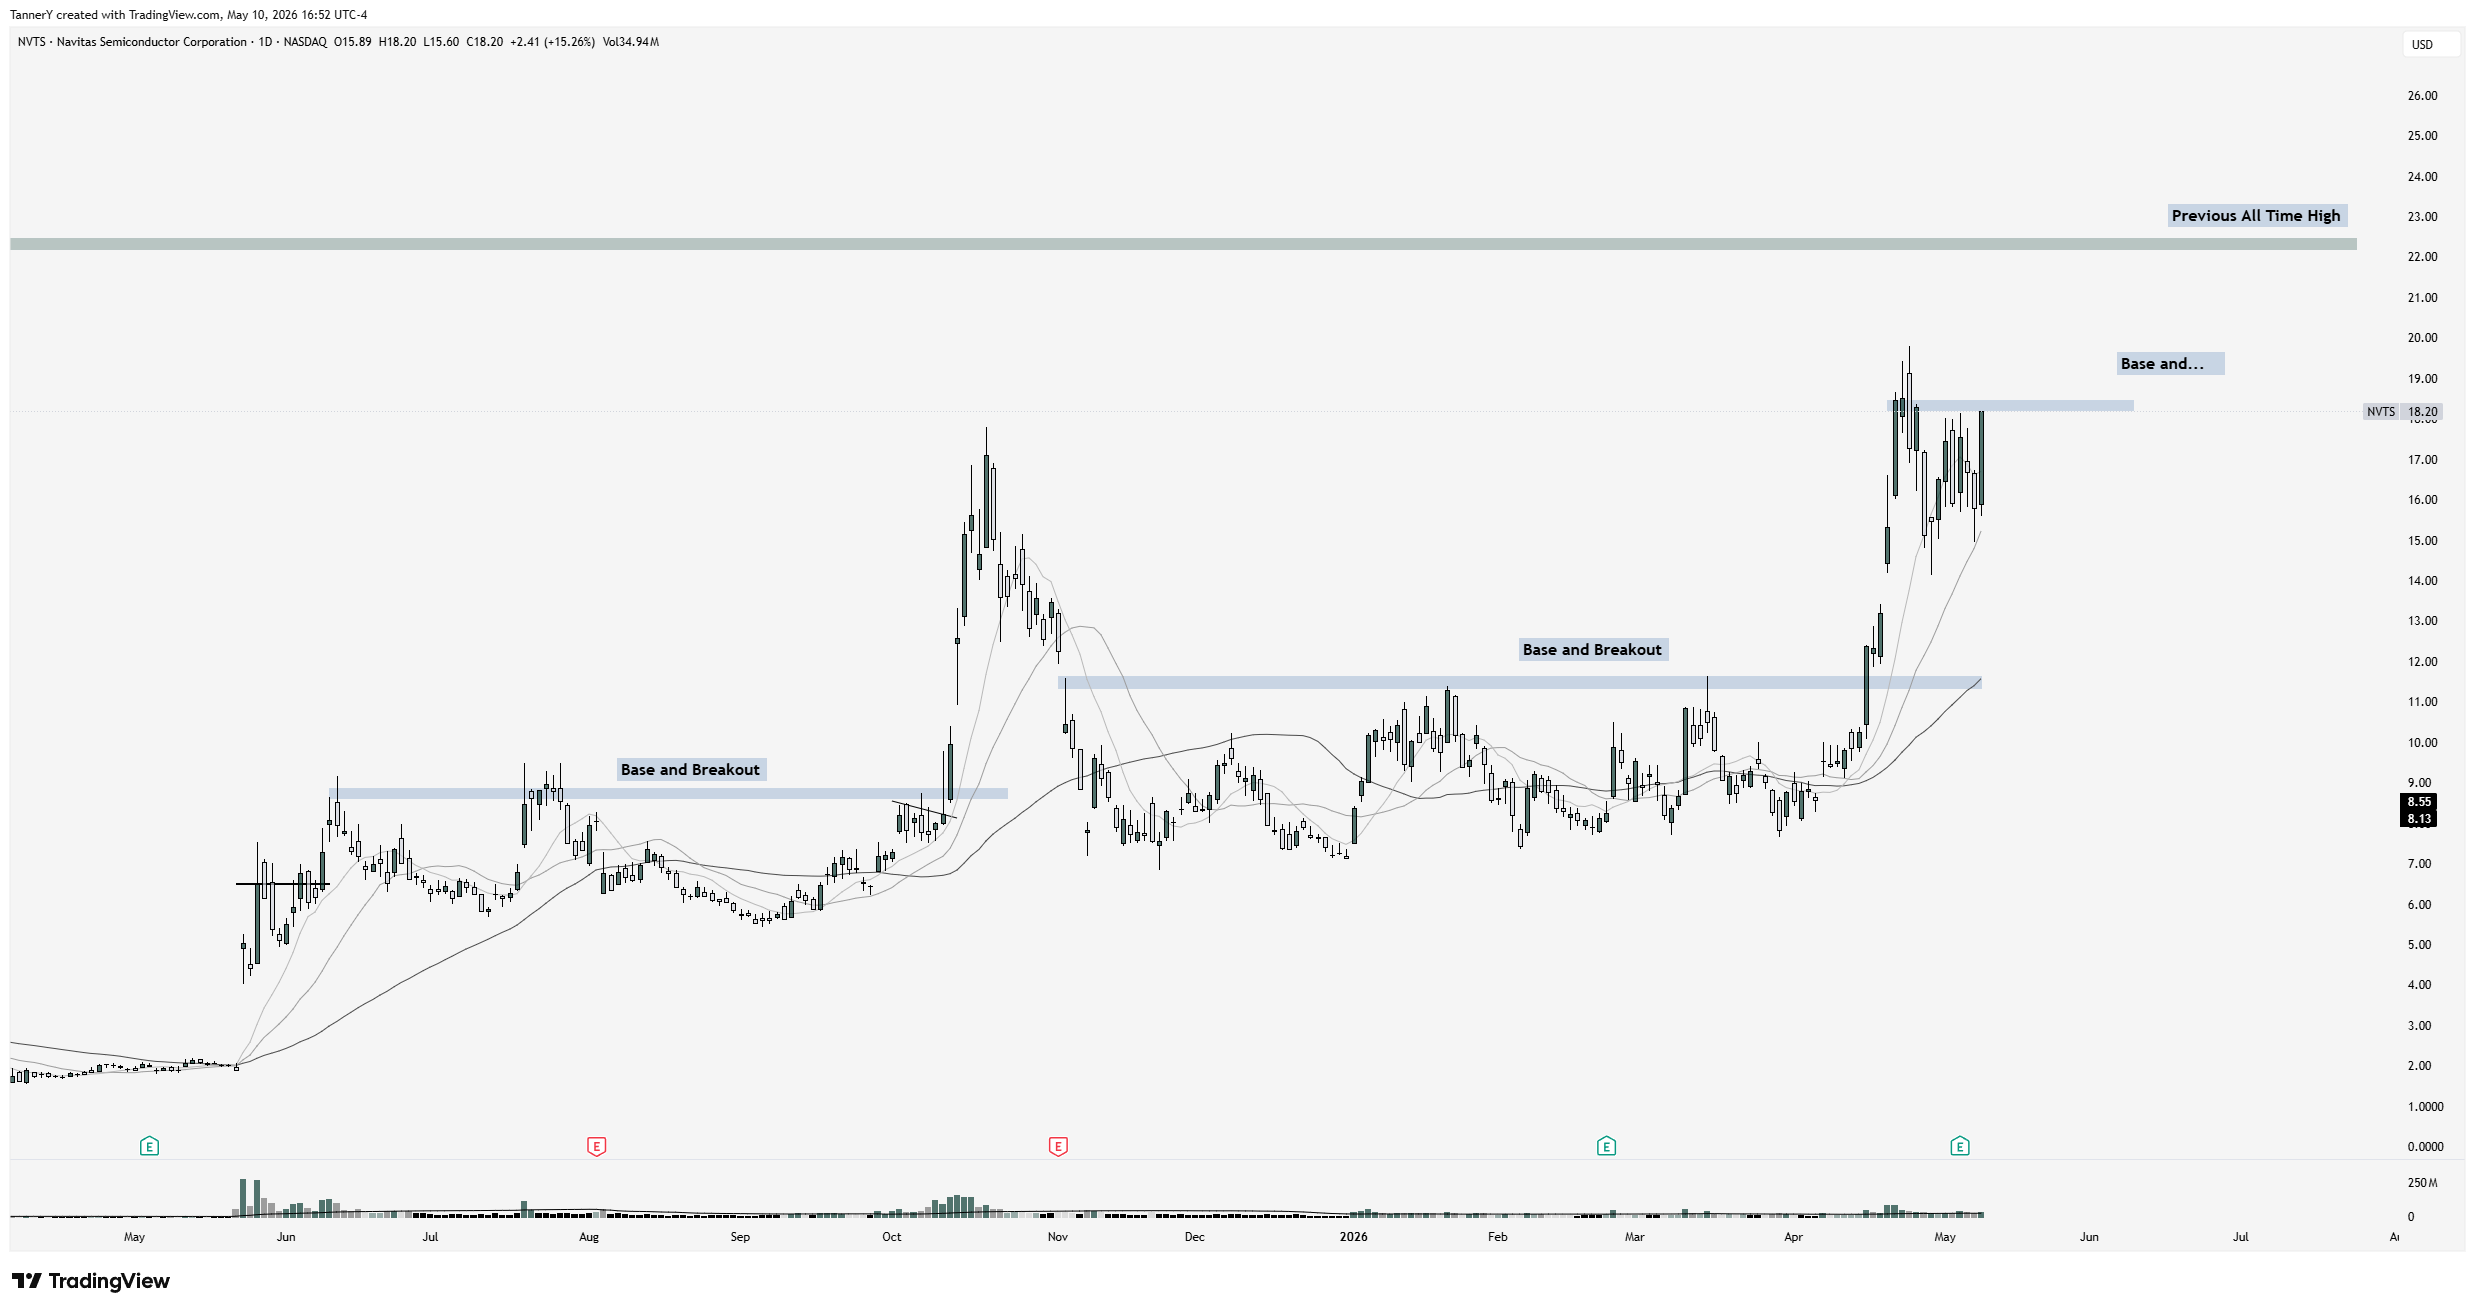
NVTS: Semiconductor continuation trade. NVTS is also in the SOXX basket, but instead of blasting like INTC, it is nuzzled right below all time highs. Something that I am tracking this cycle, is how many 2021 winners are tracking down their ATH prices and eclipsing them, and also how many of them get within 5-20% and close the gap quickly. I think NVTS represents this thesis well, as it has produced a high tight flag just below P-ATH. Note the chart and annotations below.
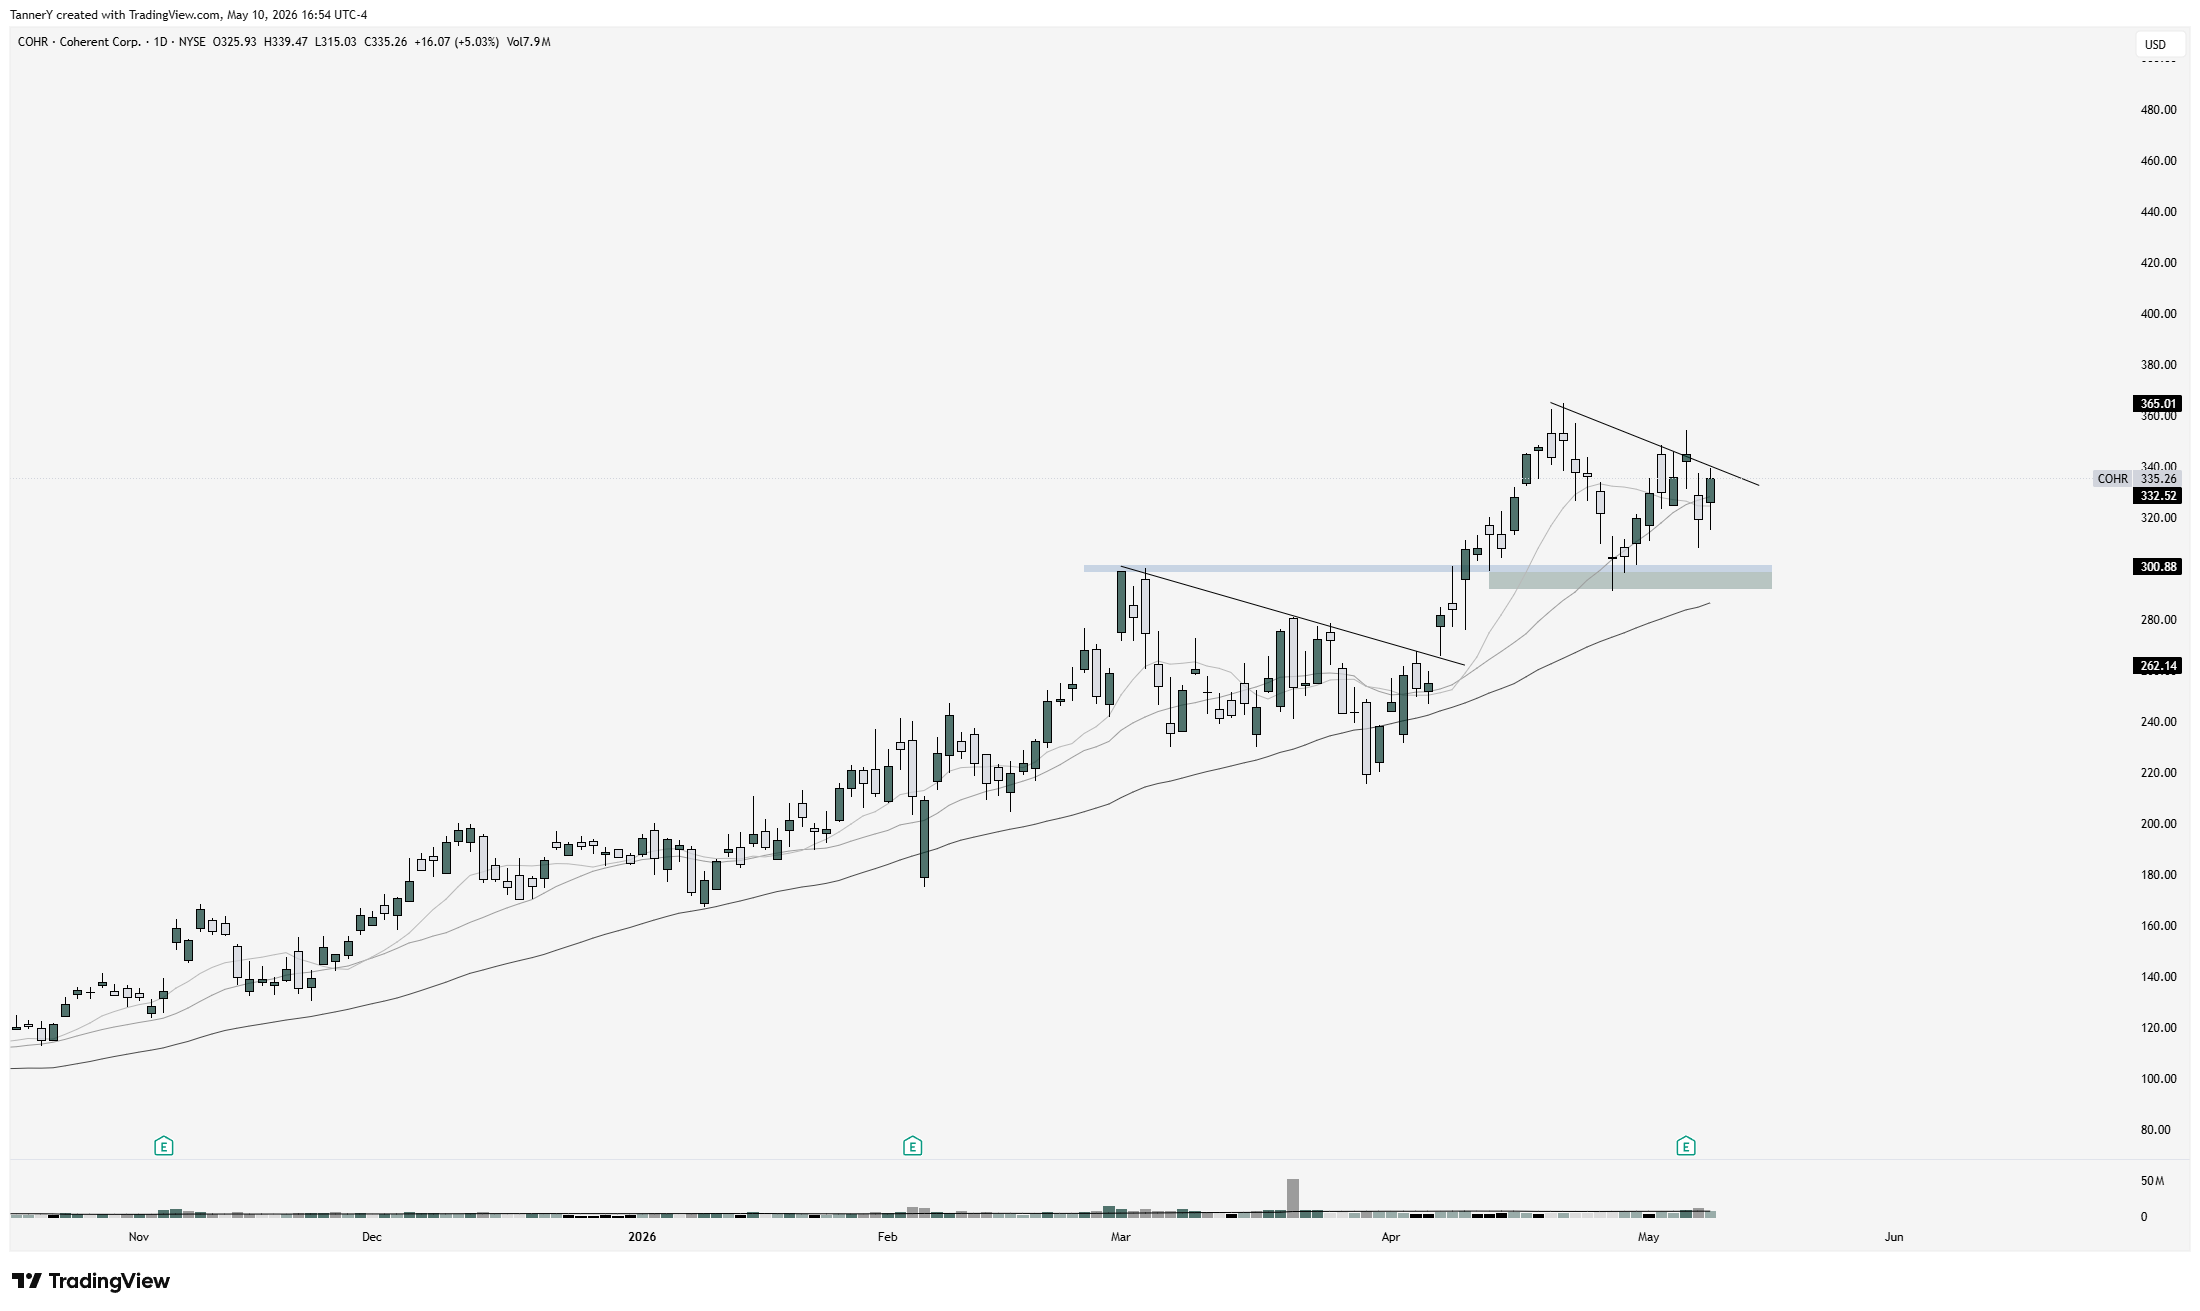
Optics: COHR. Coherent is a name I have been looking to add to for a while. Currently, I own AAOI which just produced an extremely lack luster earning reaction. I would like to roll this position (and its gains) into something more consistent in the space, and I think COHR satiates just that. It is currently setting up above $300, with a decent flag tying it all together.
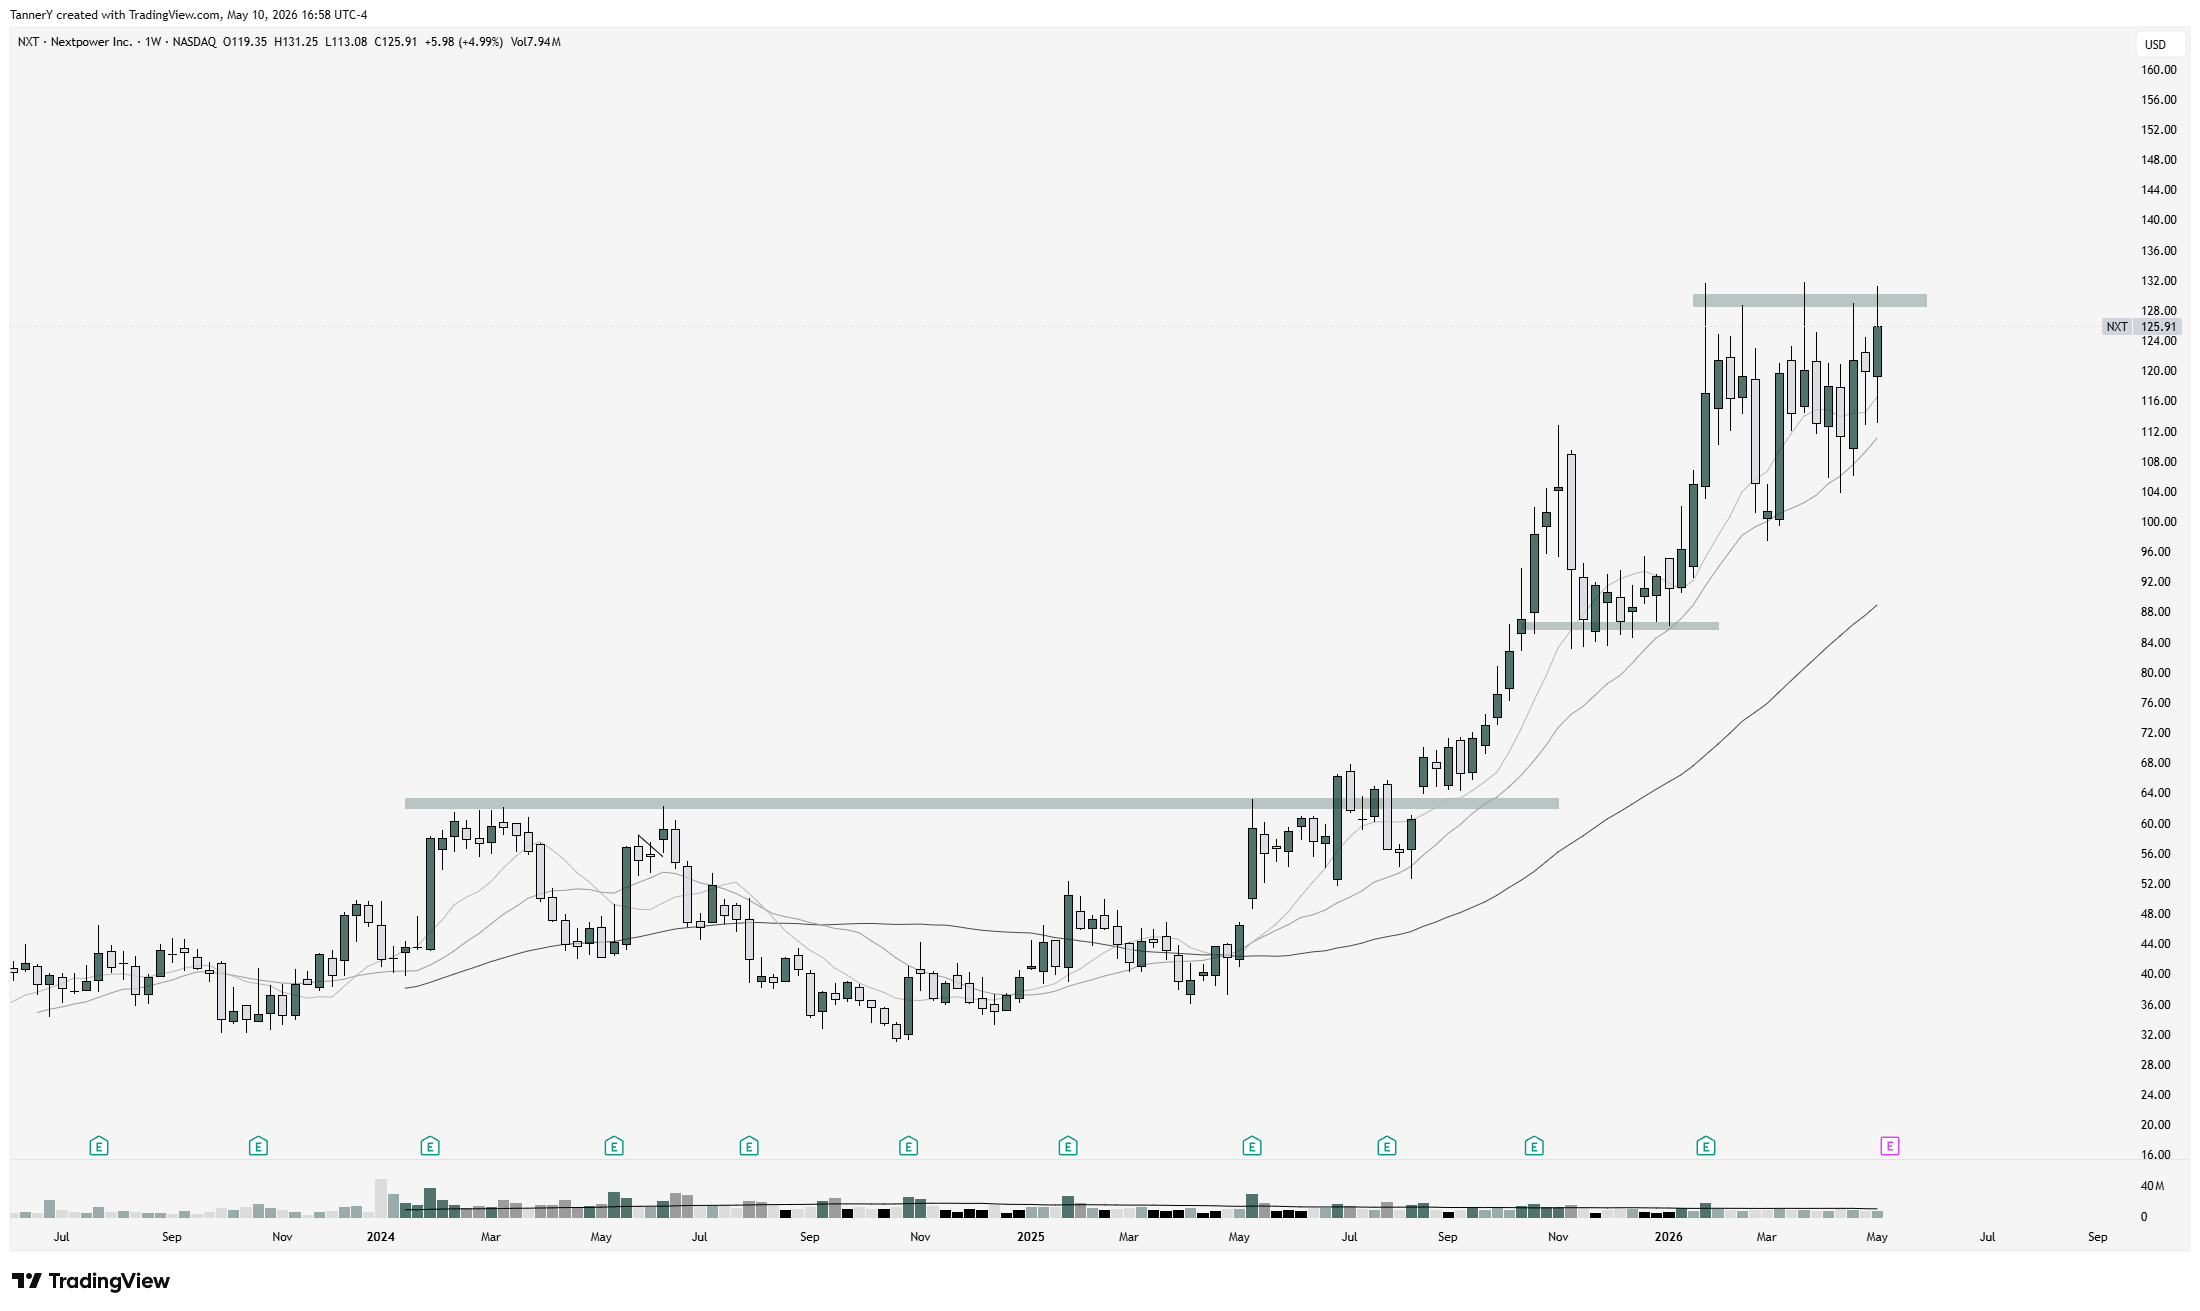
Grid and Power: NXT. NXT is a name that I have traded before, and is often described as a solar player. They report earnings this week, and I believe there is a case to be made for their power conversion systems division to produce better than expected results. If this stock gaps above its current range, It will likely PEG and make for a nice run. Heavy watch after earnings, extremely textbook.
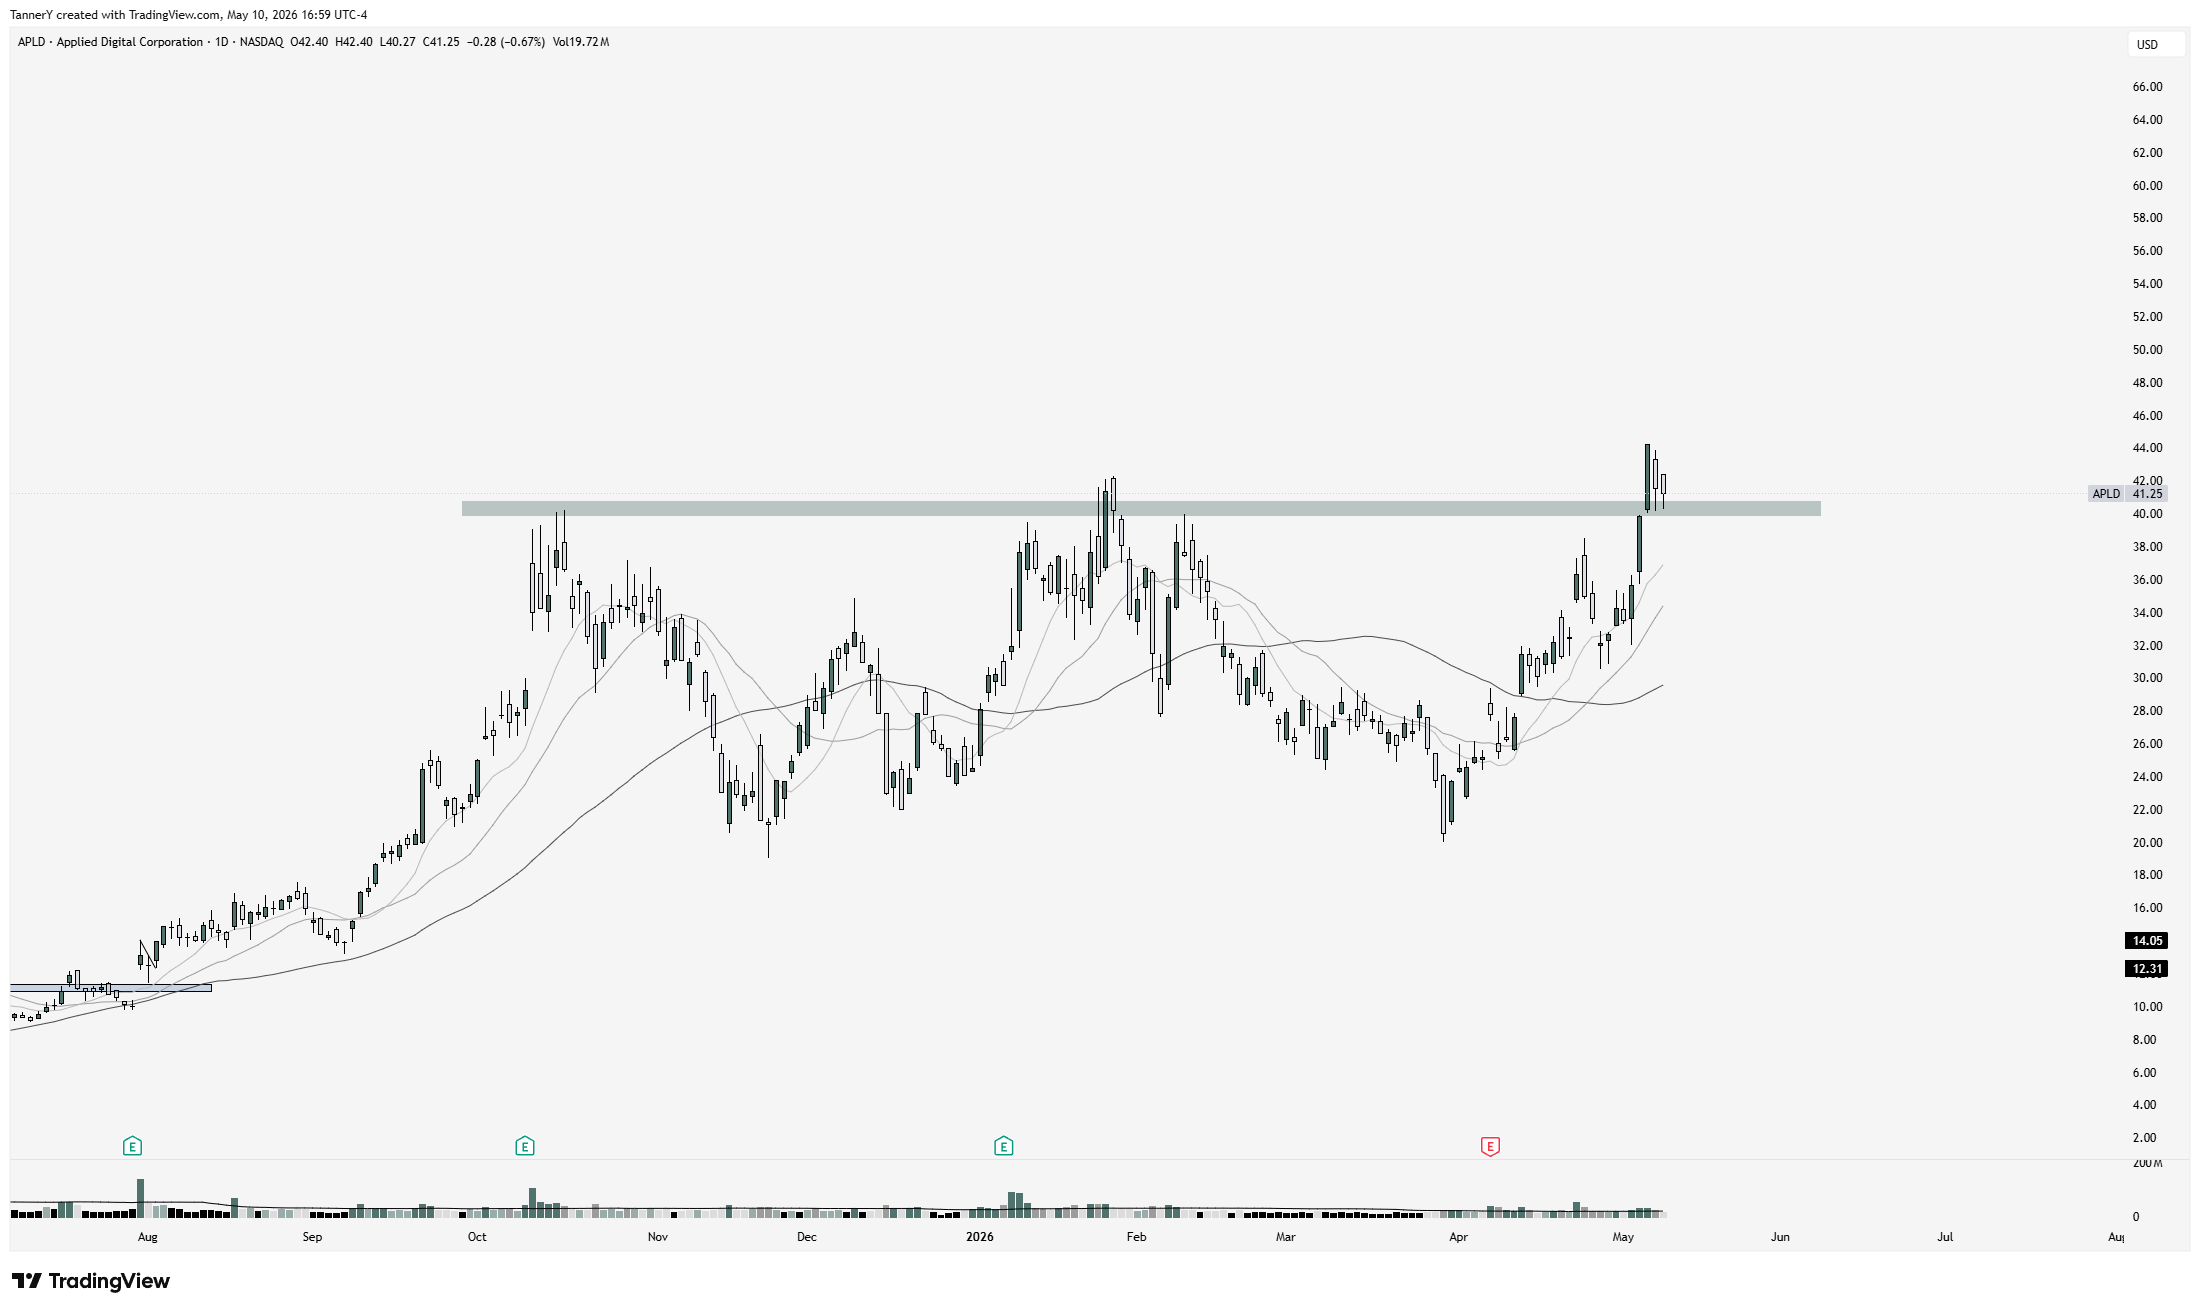
Neoclouds: APLD (NBIS). I’m not usually one for the neoclouds, In fact I’m not really a fan at all, but NBIS reports this week and APLD is setup quite nicely. Double inside day here could produce a strong move.
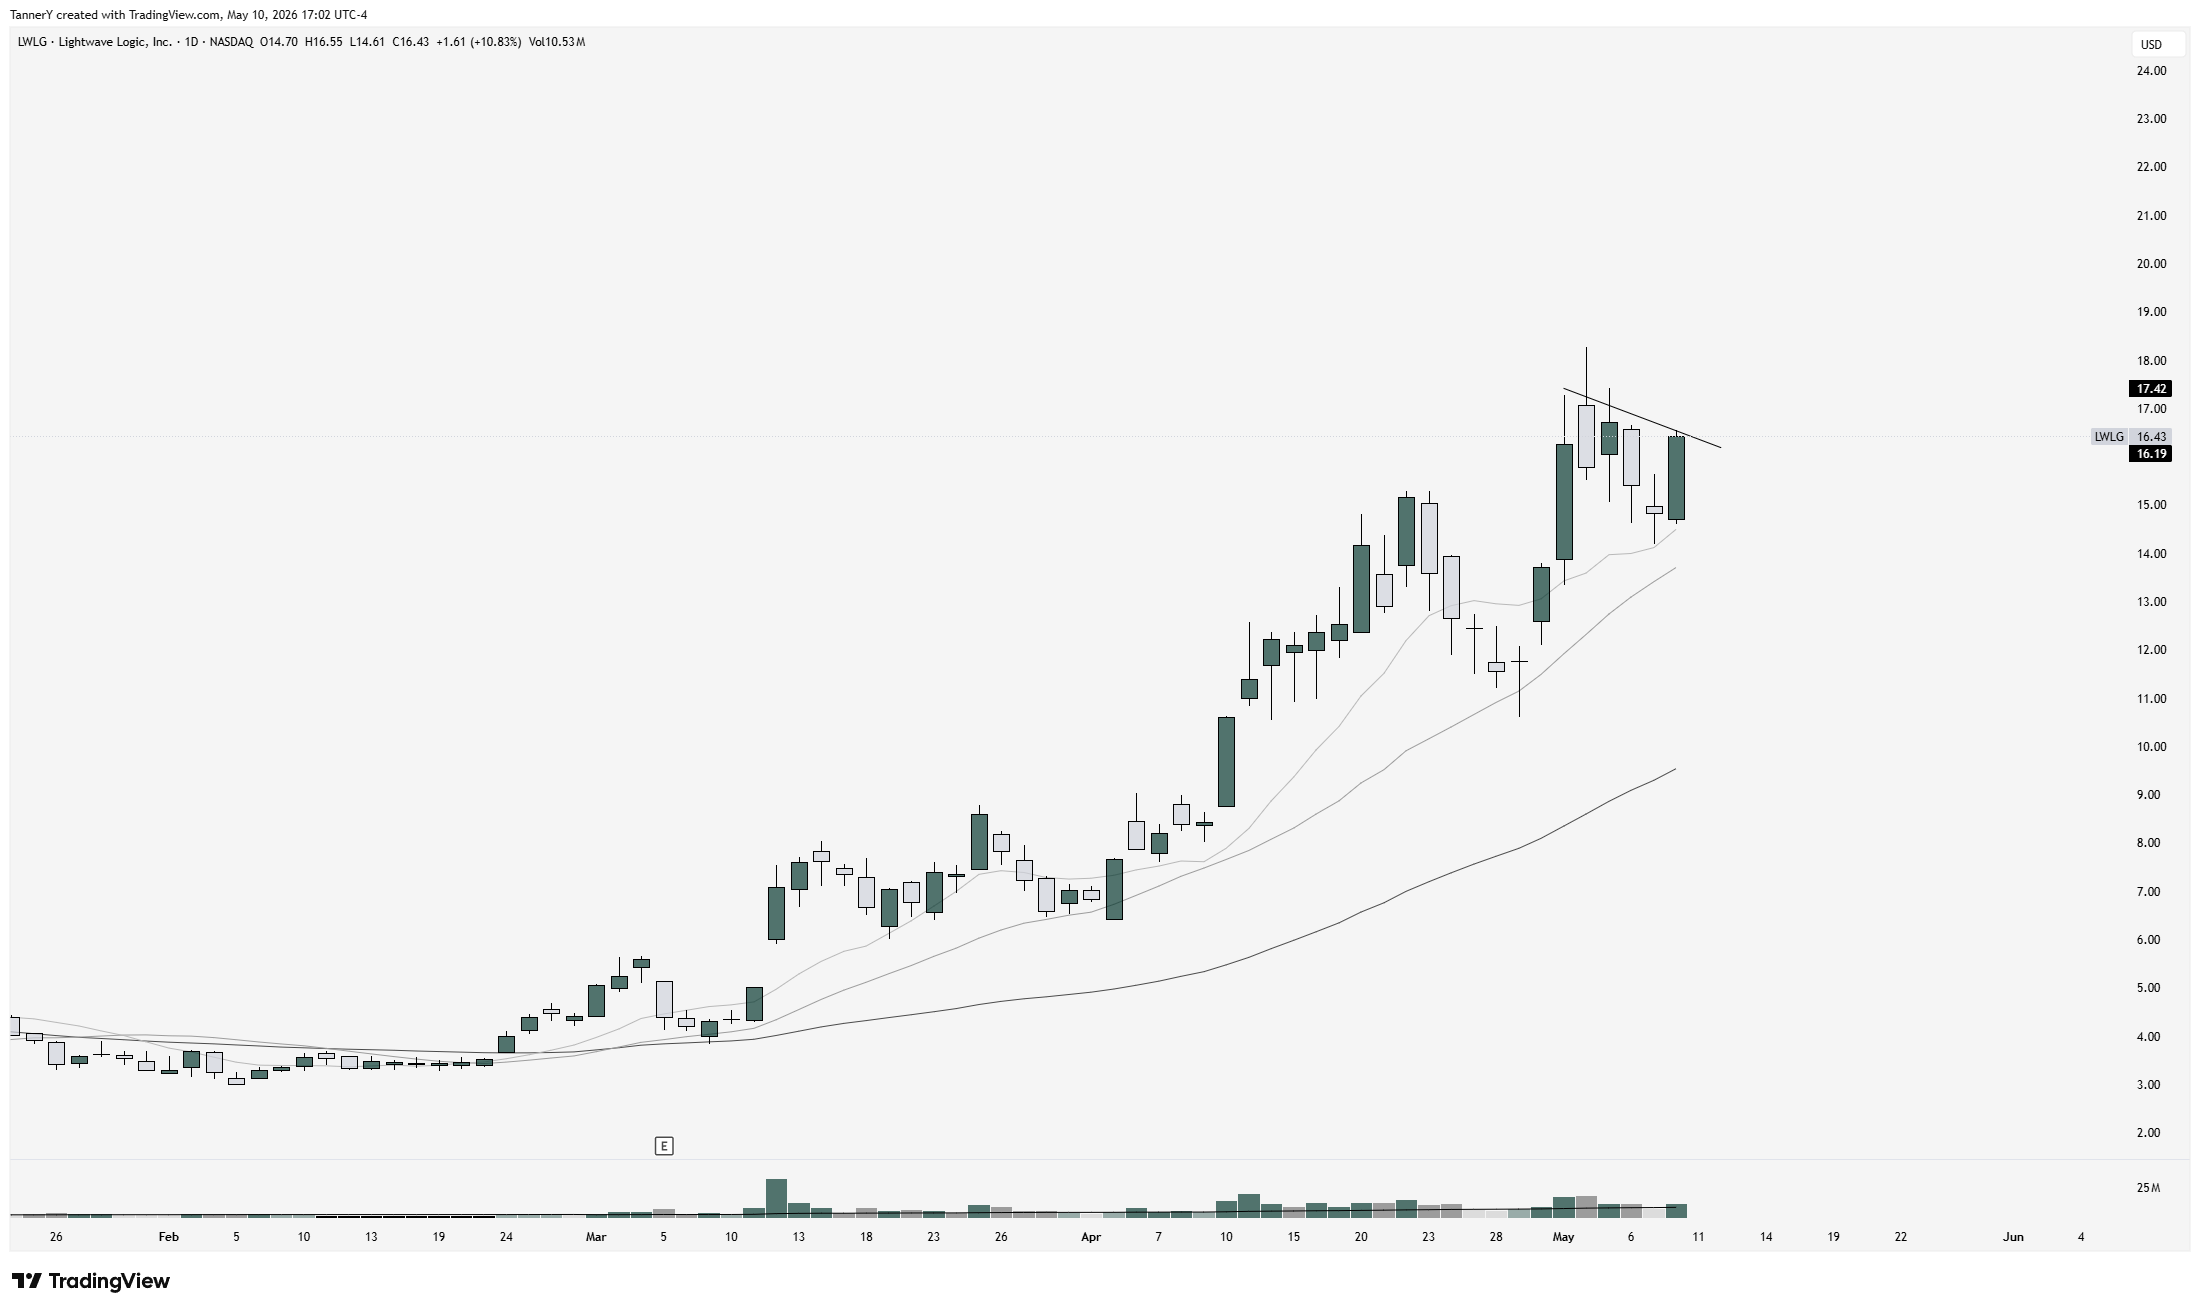
LWLG: High Tight Flag. LWLG is meeting the criteria for the high tight flag just below previous all time highs. This is a superb look on a recently exciting liquid stock. Take a look:
With all of this in mind, go forward into the week with an open mind, as earnings are still underway and we don’t know what kind of episodic pivots wait for us on top of these great setups. I know I will be watching for EPs, as its clear big earnings winners are surprising out of months long gaps, creating tremendous opportunities in this young bull cycle.
Good luck!