Investors,
As you’ve probably already noticed, this is a short week in observation of labor day. On this day we celebrate the continuation of innovation and prosperity through laborious activities. It also generally marks the end of summer, so I hope it was good to everyone!
With that out of the way, lets get into the bulk of the content for the week.
Indices
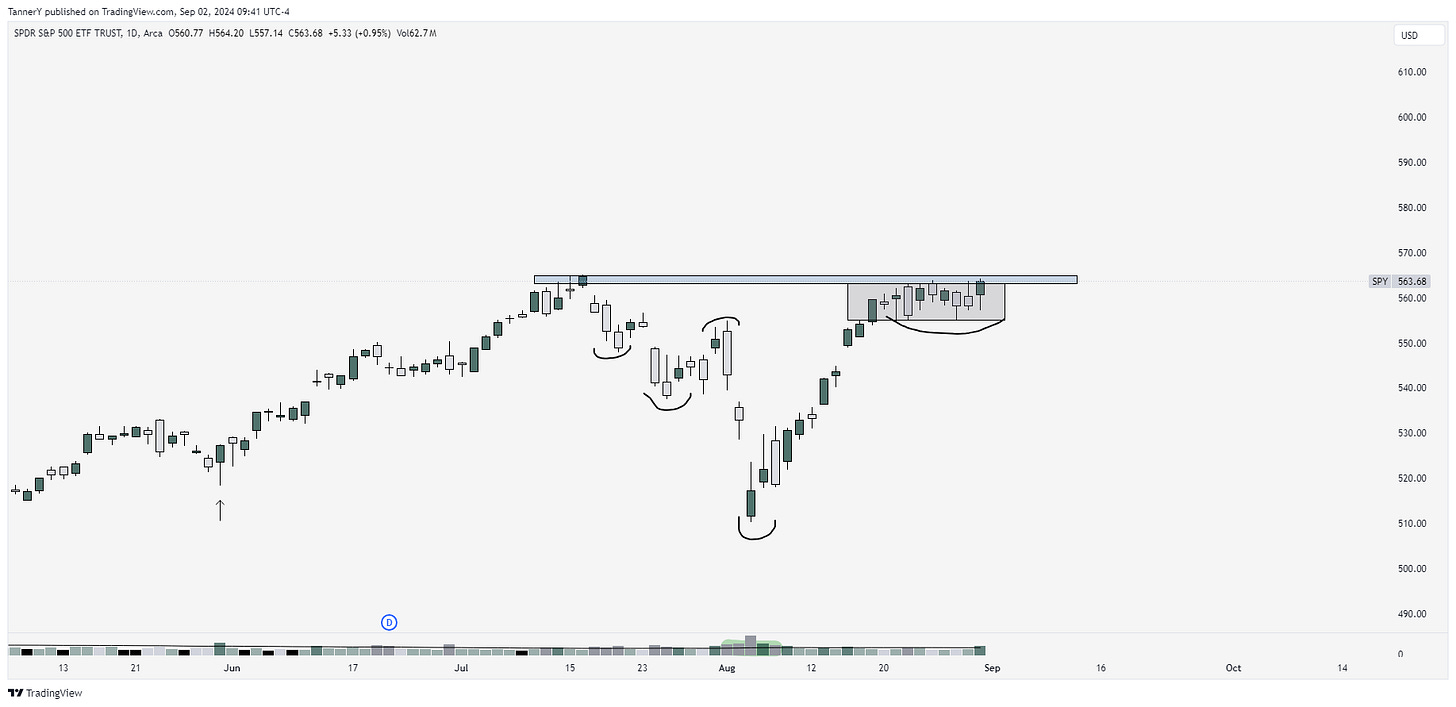
Last week indices saw consolidative price action through NVDA 0.00%↑ earnings and PCE data. These 2 important events needed to pass for the market to make any real decisions. Often, people ask why markets don’t move into important earnings or data, and I always answer in the same fashion:
If you were looking to buy or sell a security, and in one day there was information coming out that’s pertinent for you to make the decision, wouldn’t you wait? The market reacts to this information, and trying to front load or gamble through such data is not conducive to success.
This is a great look for SPY 0.00%↑. Tight action underneath previous all time high pivot. This is a very tradeable environment.
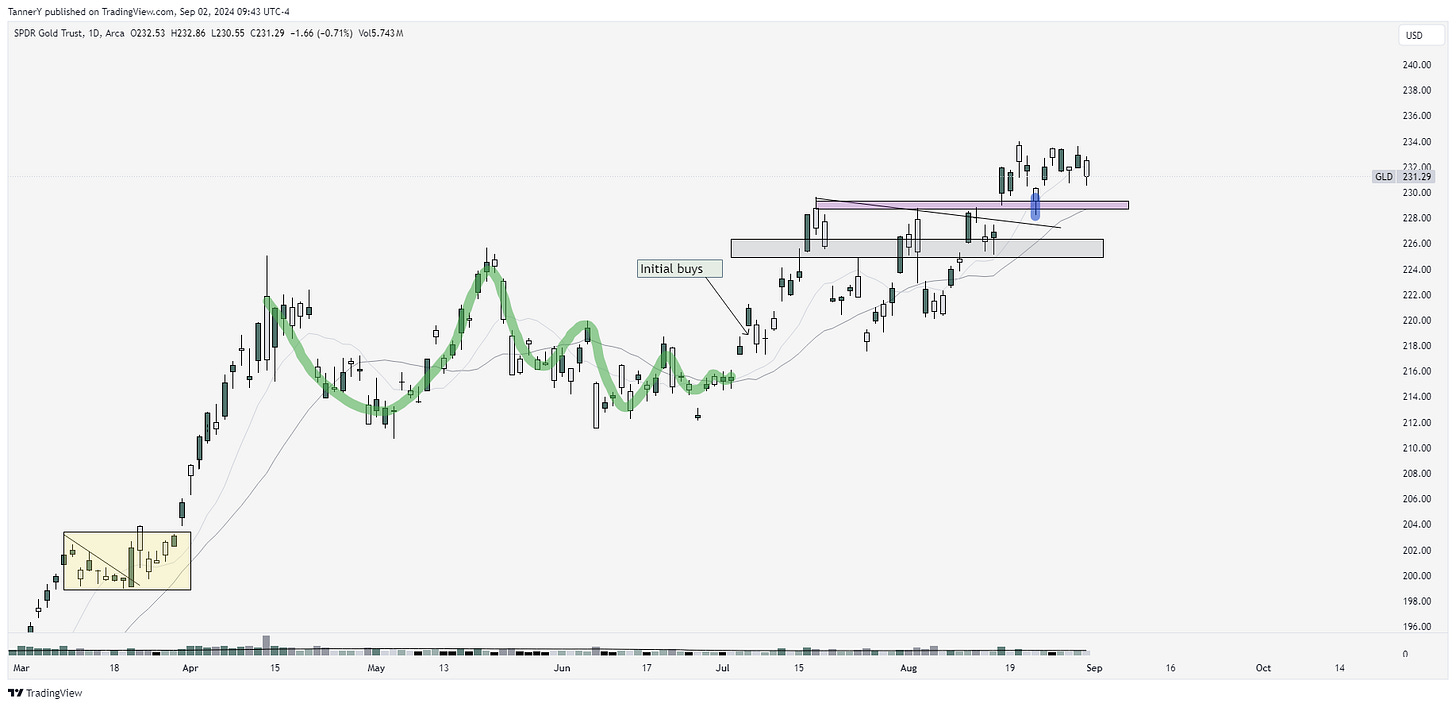
GLD 0.00%↑ breakout pullback now into SMAs. The day to day may get a little weird looking with all the gapped action, however, this structure is still strong in my opinion.
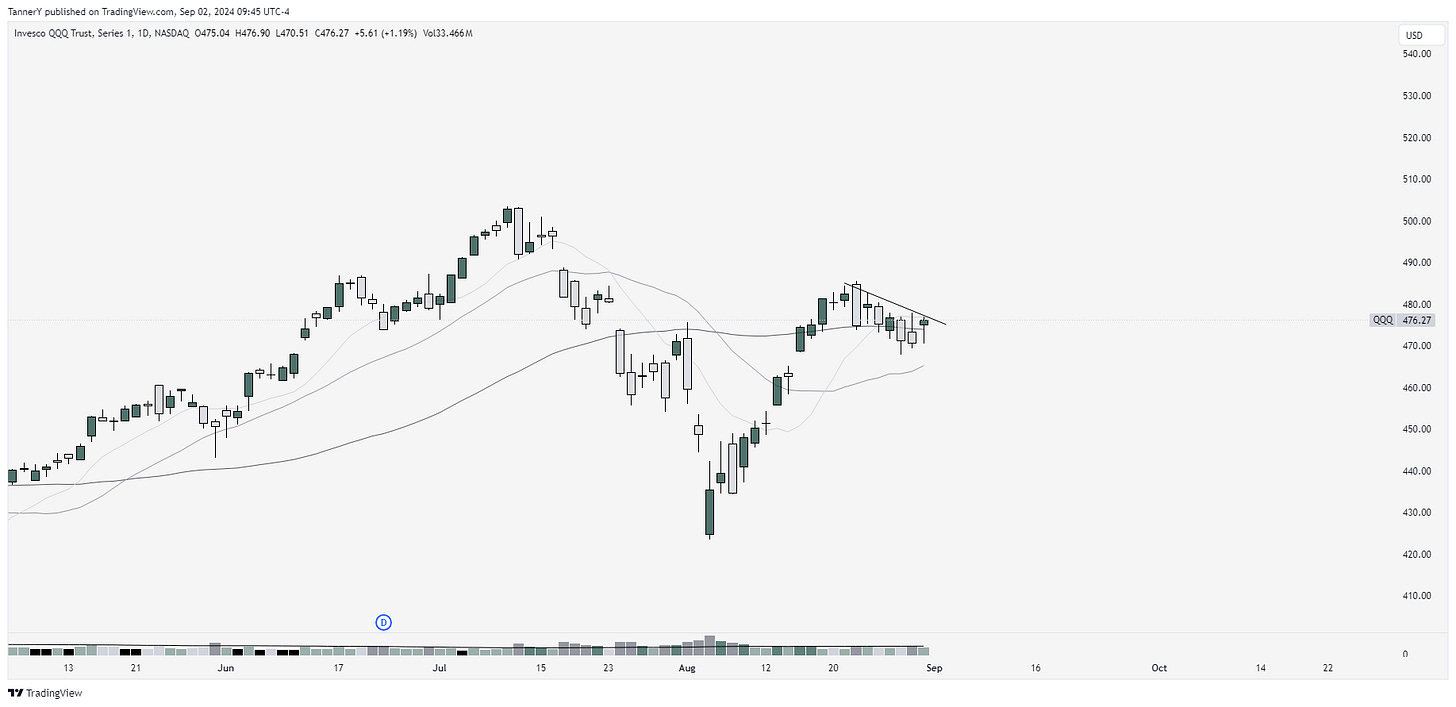
QQQ 0.00%↑ not as strong as SPY, indicating a lack of participation in the tech sector.
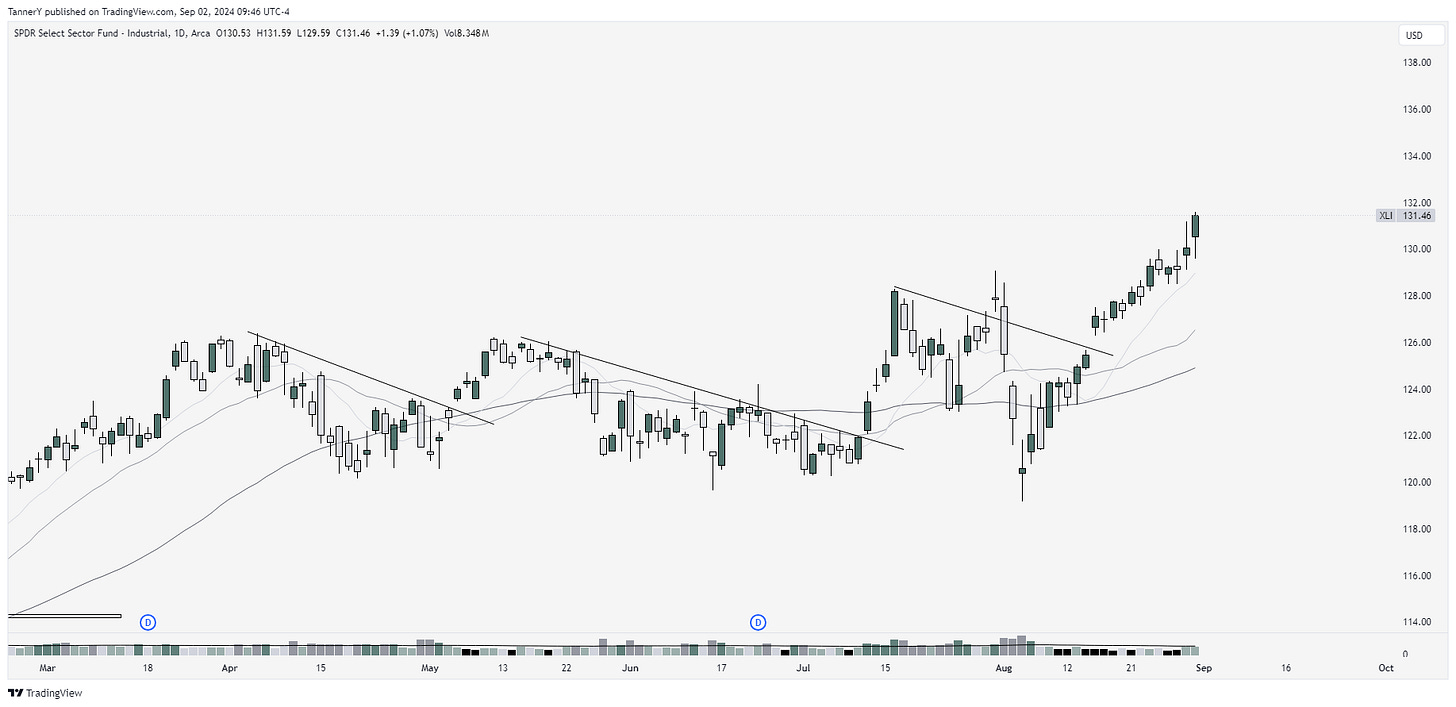
XLI 0.00%↑ industrials is assisting in pushing $SPY. as you can see, while SPY sits at ATH, industrials have pushed right up through.
what sectors do you watch?
Parabolic Trend Analysis
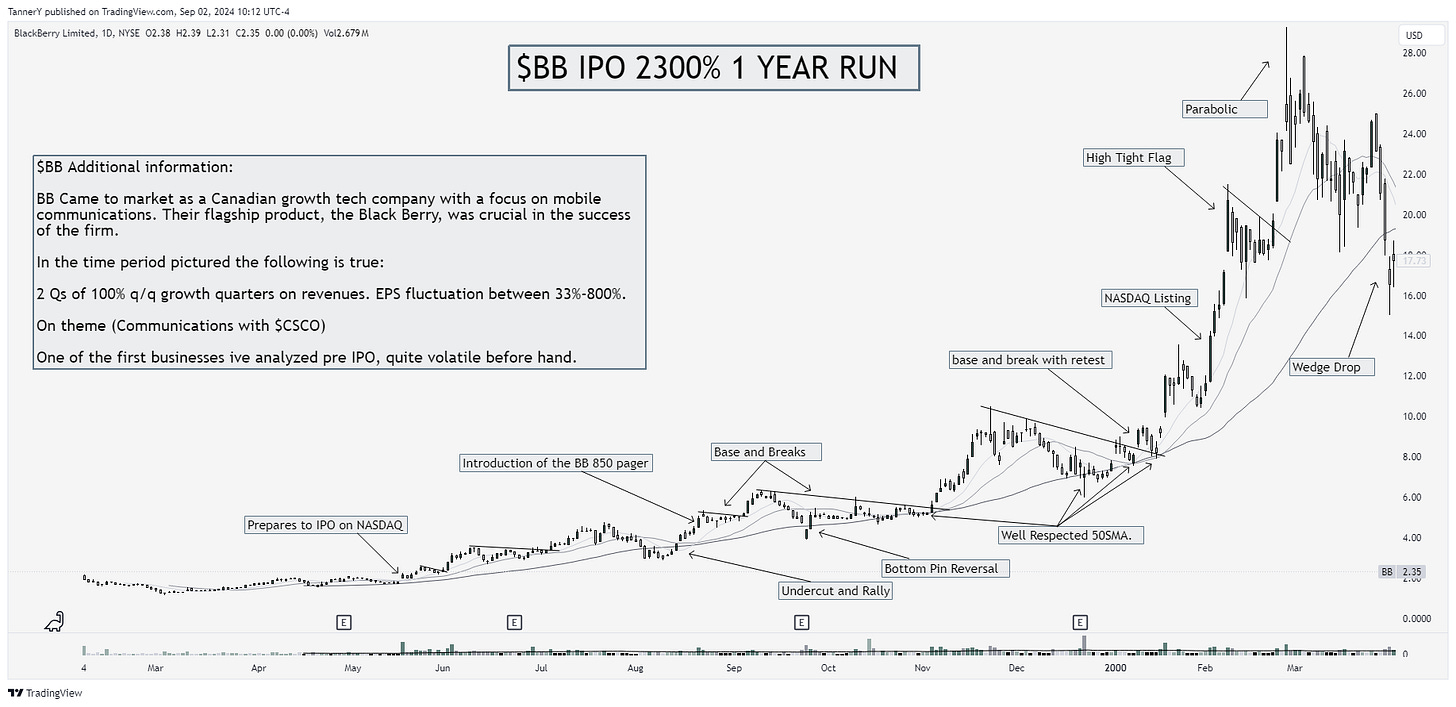
BB 0.00%↑ (BlackBerry) Saw a monstrous run leading up to its NASDAQ listing in early 2000. This run was on theme with big tech at the time, and saw a 2300% gain from the lows in March of the year prior. It ended with a high tight flag, blow off top and parabolic reversal.
**If you enjoyed this portion of the newsletter, feel free to drop a like or share as it is the most time consuming part of this FREE newsletter**
Past Performance
Not super bad considering data and a choppy market. PANW 0.00%↑, was a standout, and crypto rolled over.
Charts
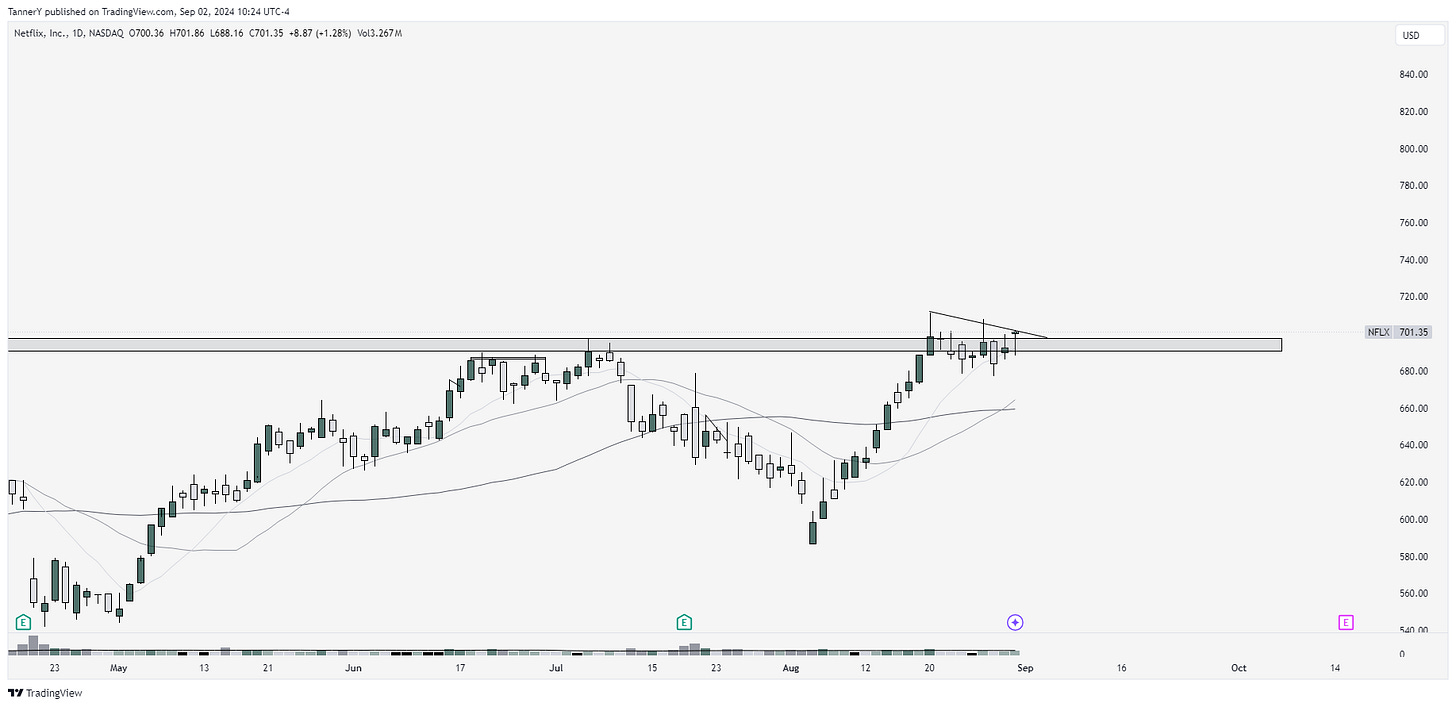
NFLX 0.00%↑ tucked right below ATH spot. I like this look here with a strong hammer candle to support.
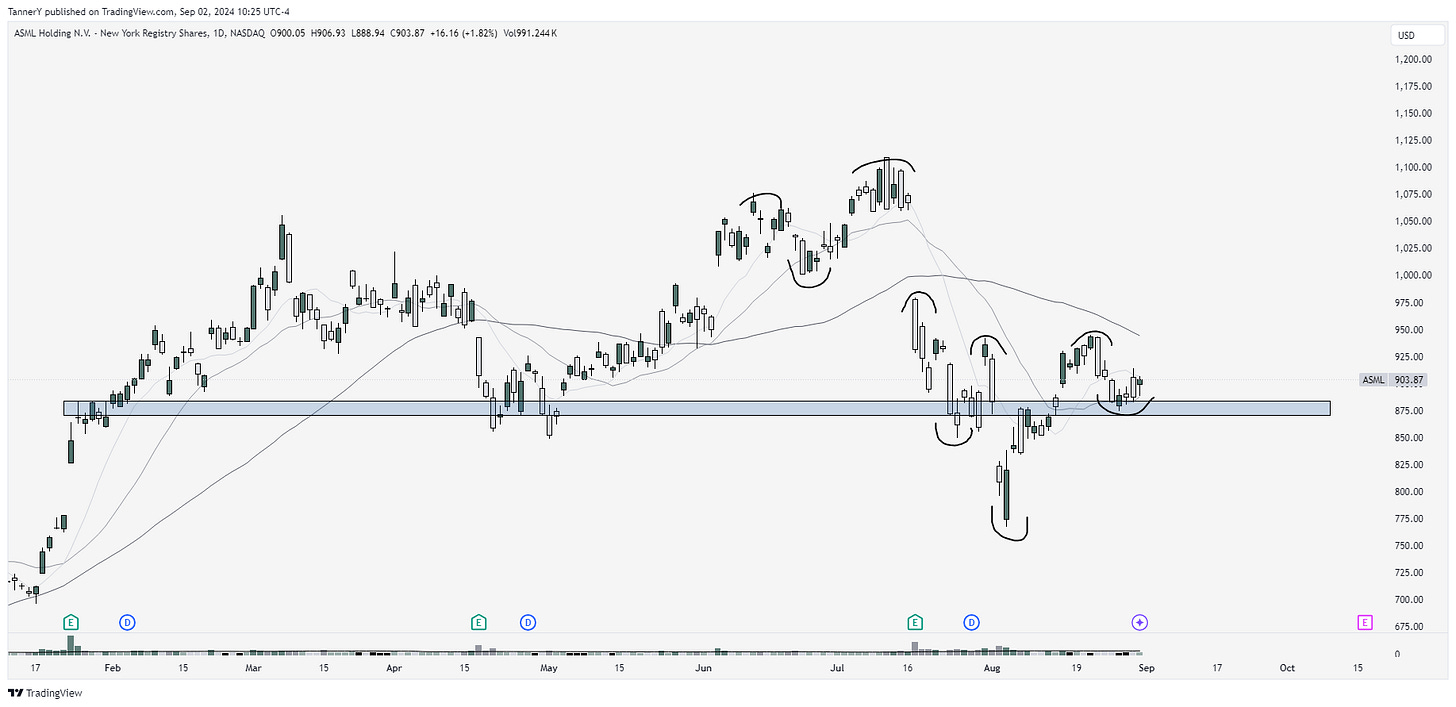
The turnaround on ASML 0.00%↑ seems to be upon on with the highs and lows analysis supporting a move higher.
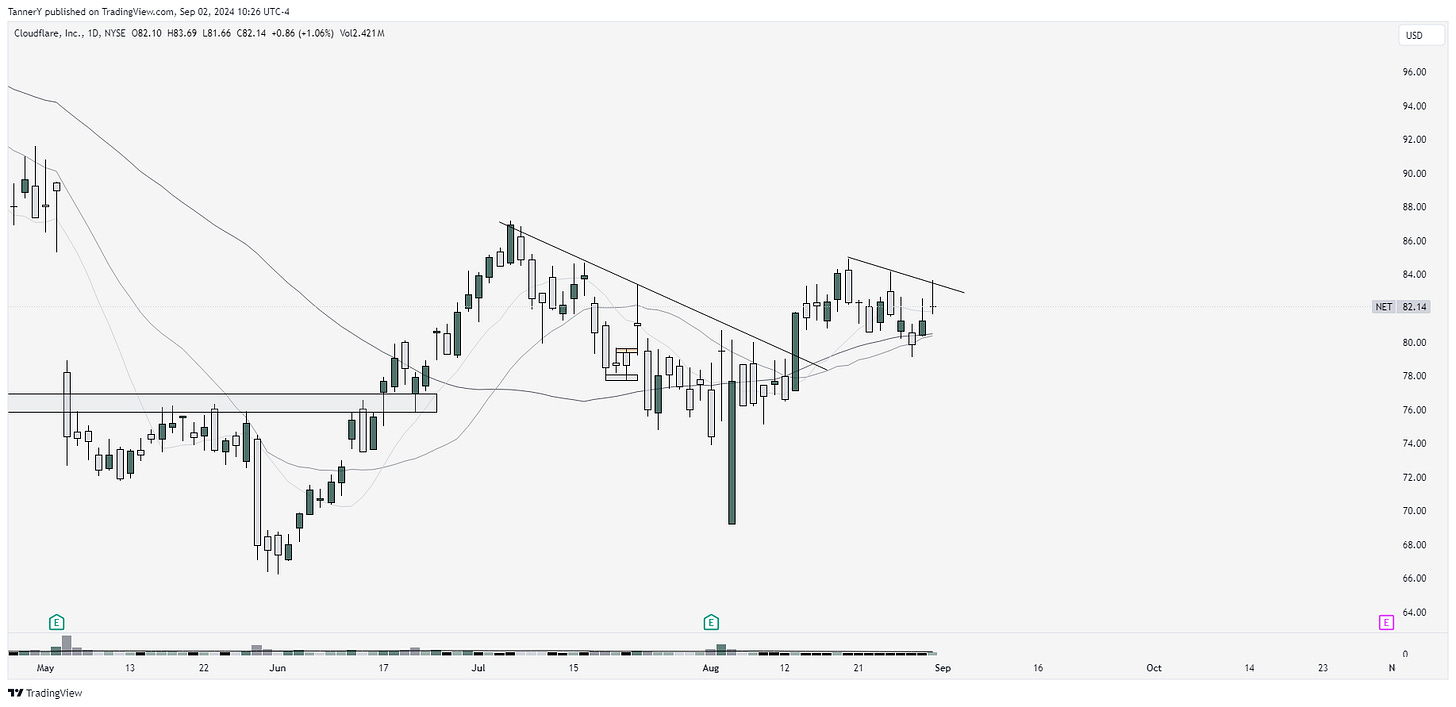
NET 0.00%↑ flag on flag action. Optionable for 83-85c.
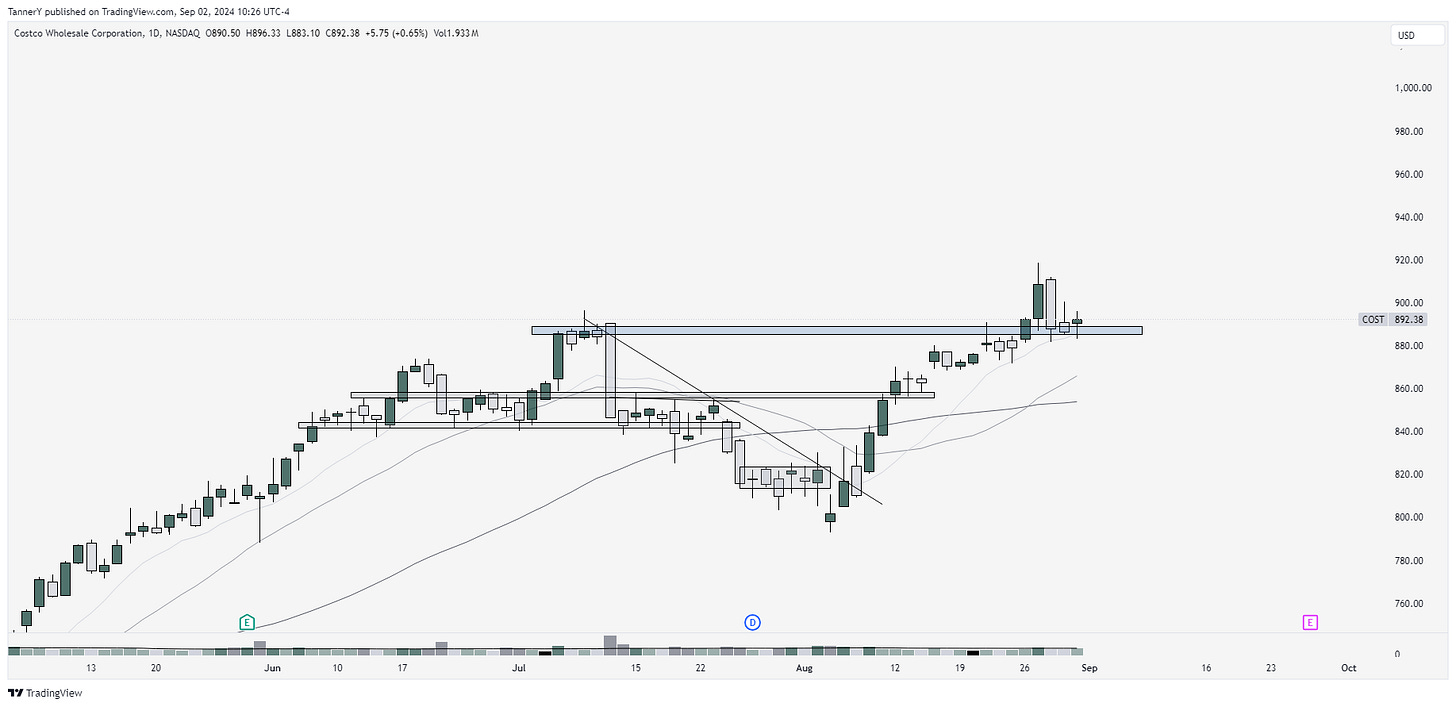
COST 0.00%↑. Pullback into previous highs. This has been one of the strongest stocks in the market for months now.
IF YOU ENJOYED:
Subscribe to the newsletter!


