Investors,
What a wild week for the markets. If it wasn’t apparent going in, it should be now, NVDA 0.00%↑ is the leader reporting blowout earnings and moving higher. As I do my usual Sunday research, I’m constantly looking to see how often stock groups are moving together, or if there’s any personality to specific names. Right now I am not seeing much outside of semis, oil and one or two tech names. That being said, with the strength we’ve seen since NVDA ER some other groups may come into rotation, so its important to keep watch.
Indexes
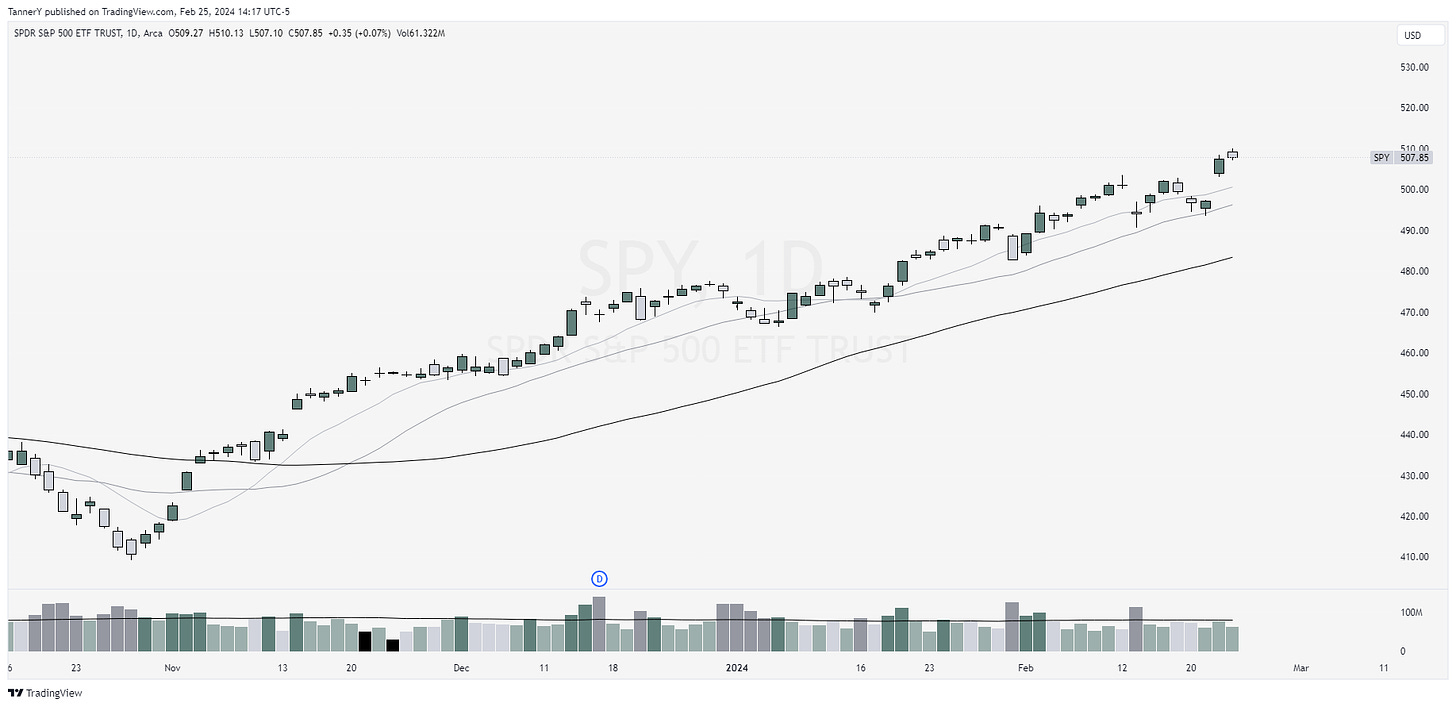
SPY 0.00%↑ looks like a swing traders dream. Highly liquid, surfing its 10/20 sma with the 50 steadily below. As I mentioned before, NVDA ER impacted markets on Thursday, gapping all of the indexes its apart of. I personally am not a fan of one stock holding so much power, but it offers good opportunities in related names, which is fine by me.
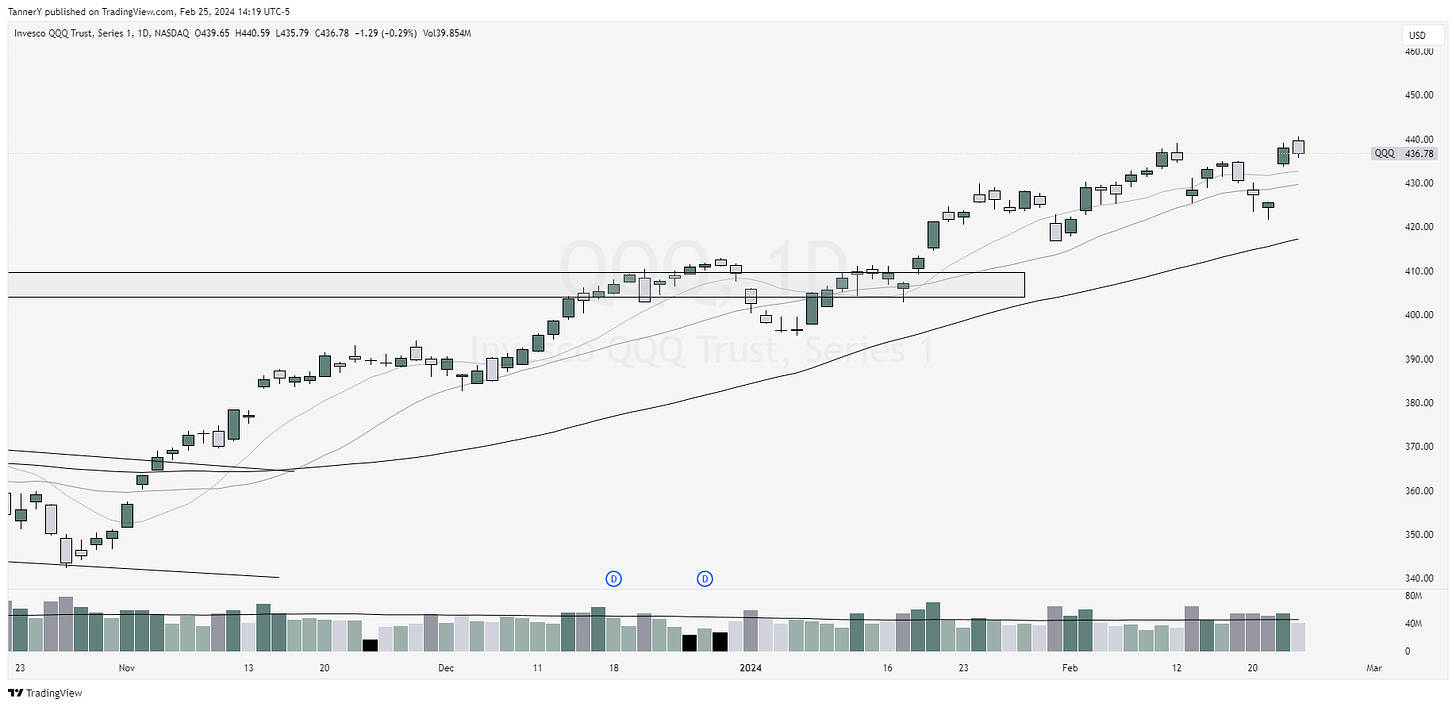
QQQ 0.00%↑ actually underperforming SPY 0.00%↑ which is interesting. As ive mentioned before, QQQ 0.00%↑ is a much more tech heavy index while SPY is more of balanced look at all the primary sectors. Seeing this discrepancy in gains leads me to believe that some other groups are starting to turn up, which could definitely cause this.
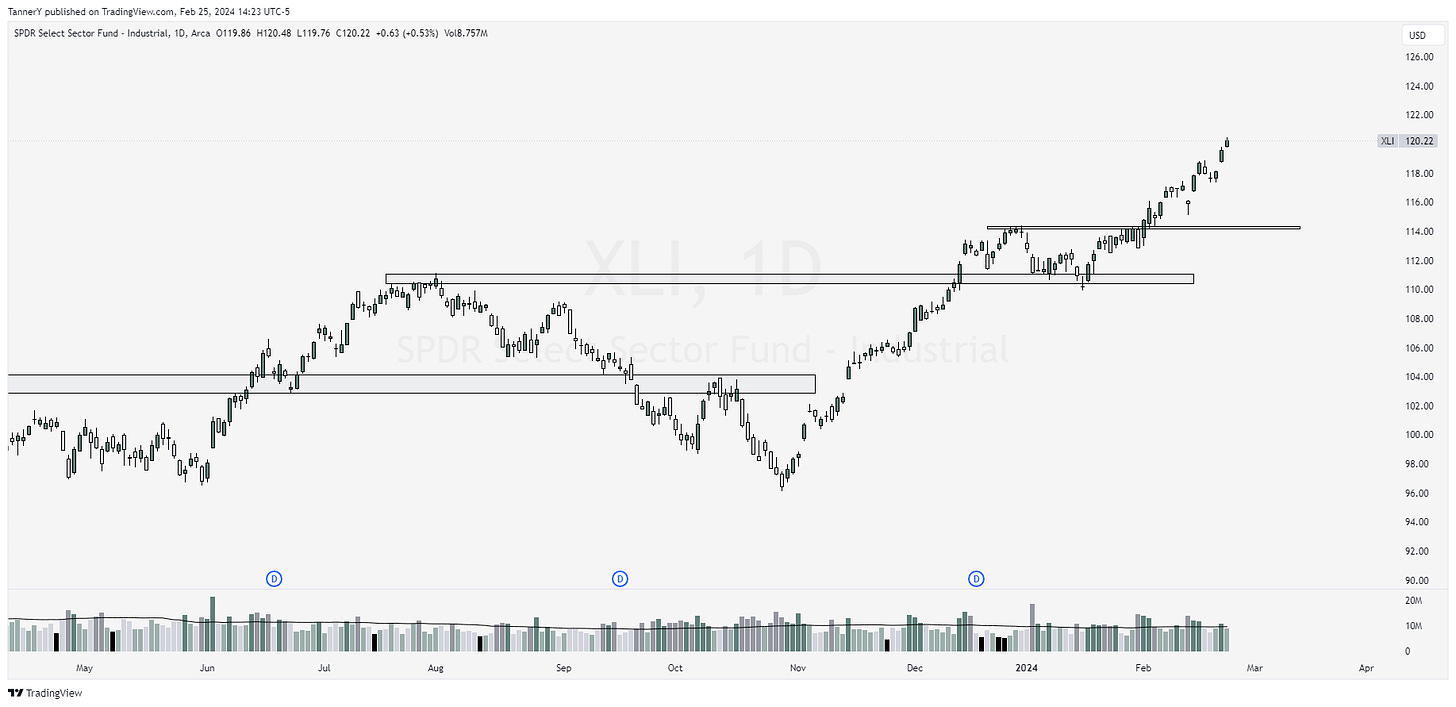
XLI 0.00%↑ is one of those sectors. The industrial group has been hot recently, moving up on UBER 0.00%↑, ETN 0.00%↑ UNP 0.00%↑ gains. BA 0.00%↑ is also apart of this group, although its performance has been incredibly lackluster. Seems many wont touch it with a 10 foot pole due to all the bad press around their aircraft, and rapidly improving competitor, Airbus.
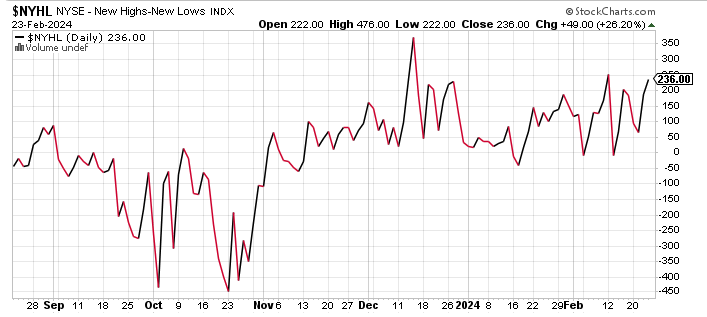
Here’s a look at the new high/new low chart for the NYSE. Last week was strong, unsurprisingly. This gauge really isn’t anything actionable, but does offer a quick broad market look to better understand where the market is, past the headlines we see for the same 7 stocks everyday.
Parabolic trend analysis
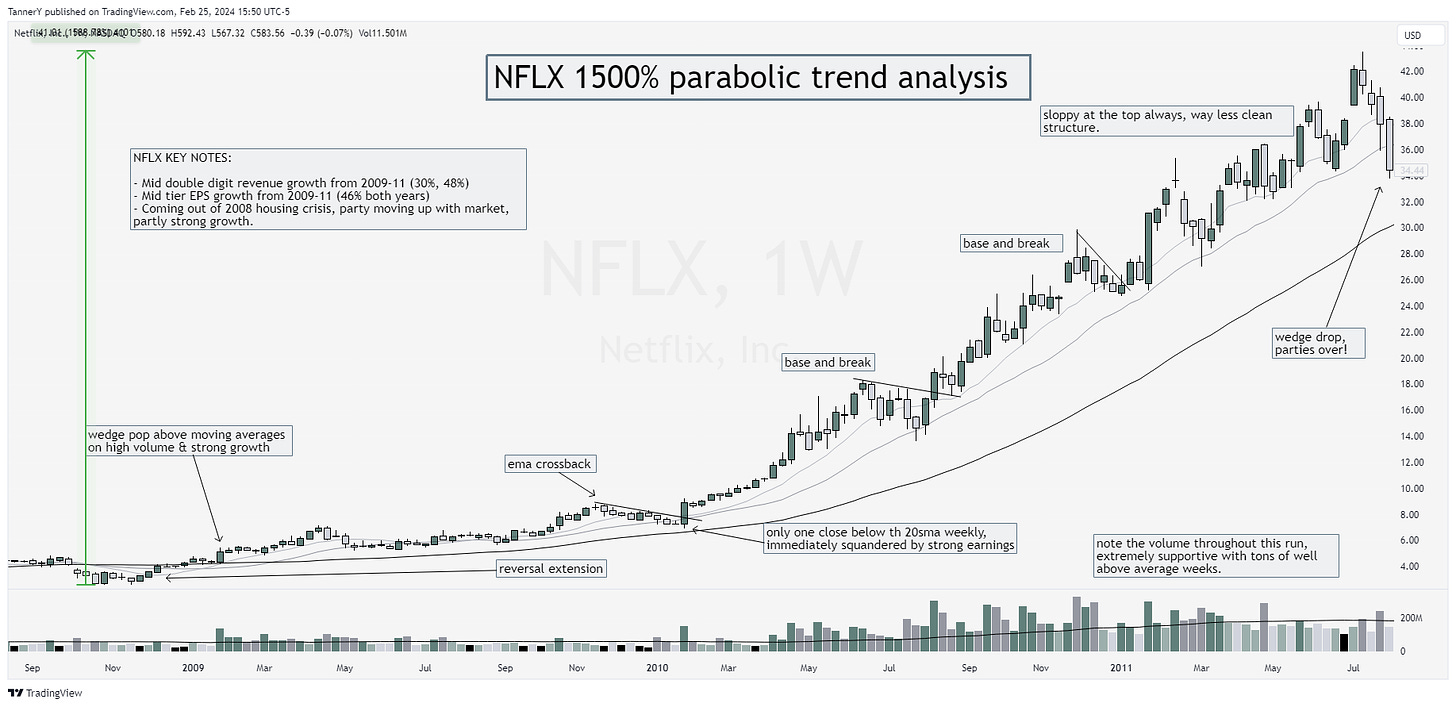
NFLX 0.00%↑ from 2009-11 is this weeks parabolic analysis. Its no 10000%er, but this super clean run from post housing crisis is one to study. Note how smoothly the stock trades, and as we approach the wedge drop, price begins to get sloppy. I think if you take anything from this chart, its to watch for sloppy action. This chart went from 4 clean base and breaks to nothing of value rather quickly.
Past Performance
My stubbornness is definitely showing in a market like were having. Instead of putting the same 7 stocks everyone else has on their watchlists, I continue to try and find other areas to find value, hoping to remove the monotony in all your research this week. That being said, my individual ideas continue to get pillaged, so this week I will adjust the strategy.
Charts
Alright lets get into some high quality setups for the week ahead:
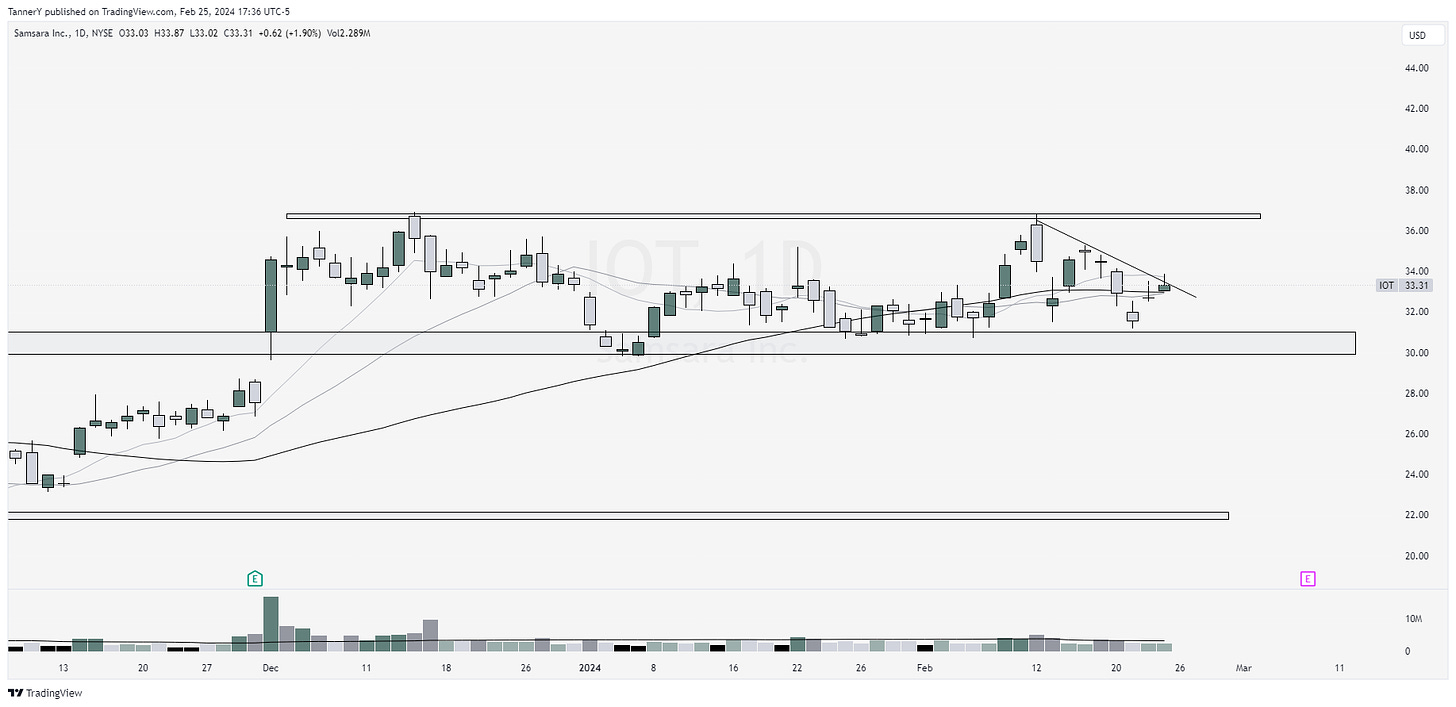
IOT 0.00%↑has been a tricky one to trade for a while. I don’t see how this doesn’t push into earnings given their astounding growth, flip to profitability as well as being in an emerging industry group.
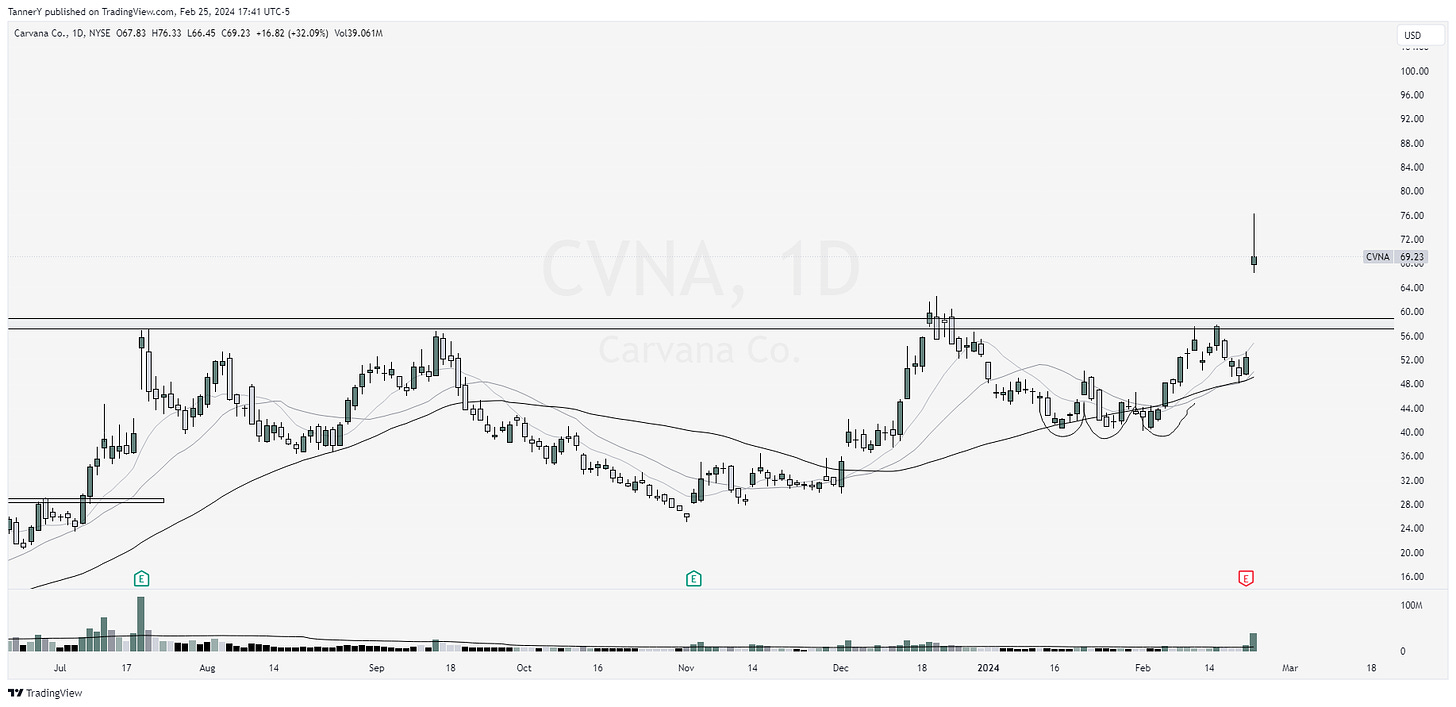
CVNA 0.00%↑ had an opportunity to make an Episodic pivot move on this er Friday. I tracked it and would have liked to see more volume and a better closing candle. This weak look + the size of the move the stock made makes me think this will be a good short opportunity. Id like for it to come back in and retest $60.
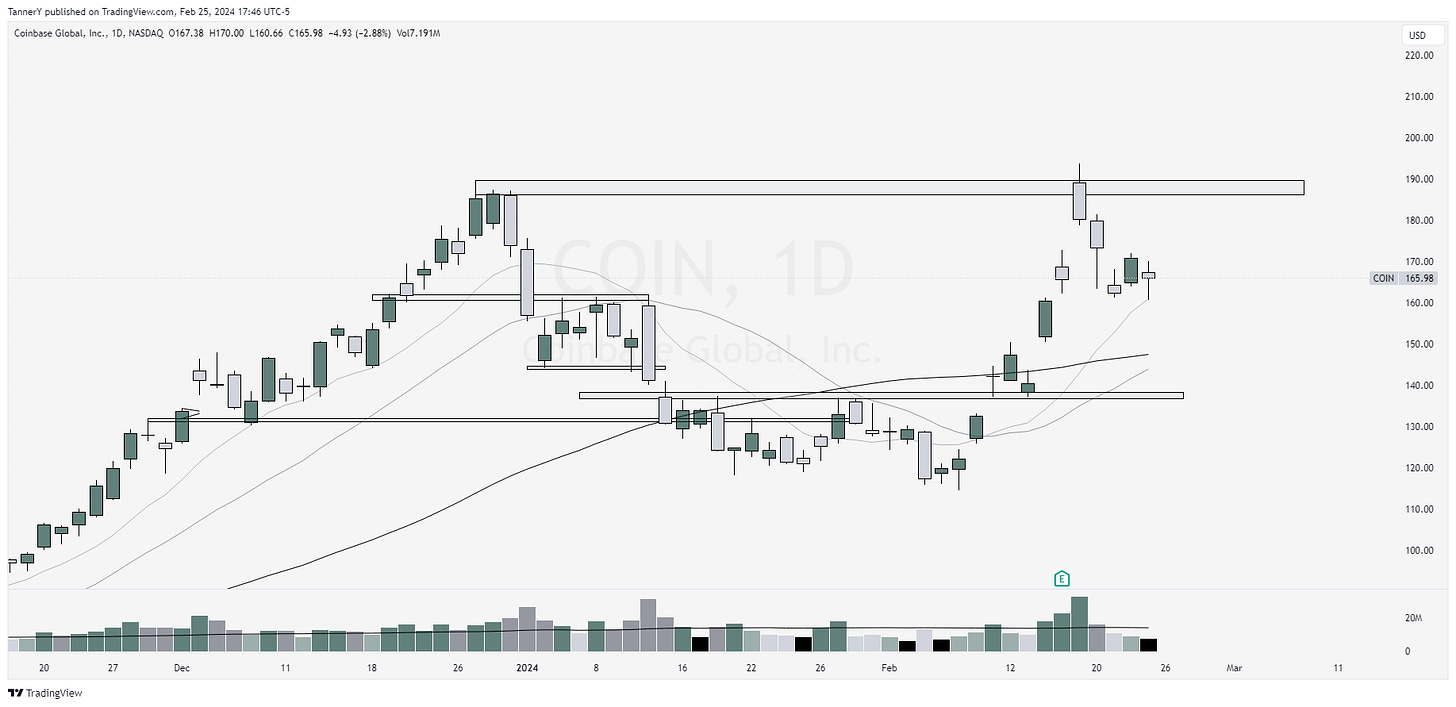
COIN 0.00%↑ with a sneaky cup and handle on the daily. Bouncing off the 10sma, crypto looking strong over the weekend, I could see this pushing back to retest the highs around 190.
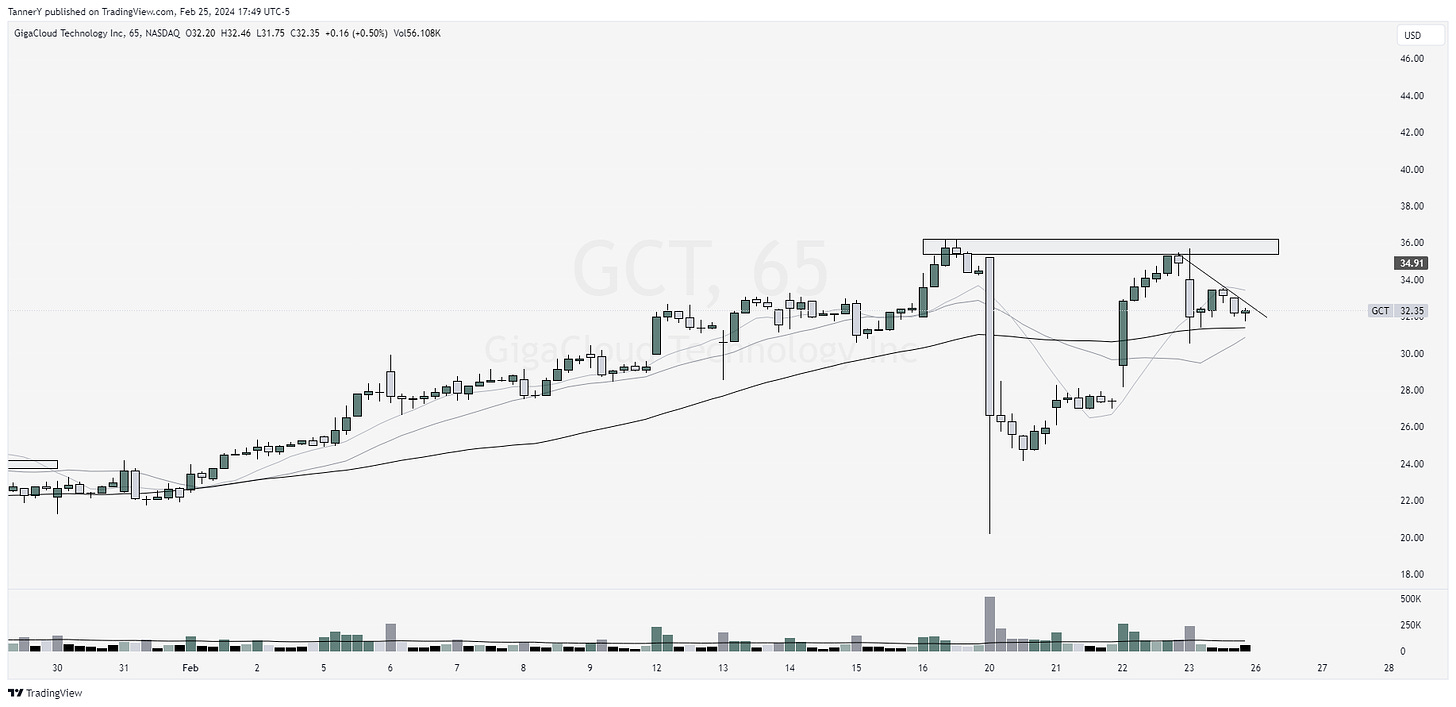
GCT 0.00%↑ feels like that UPST 0.00%↑ interview from way back when where the guy is talking about how much of it his hedge fund owns of it, but has no idea what they do. GCT 0.00%↑ took the market by storm a month ago and has only let up once. This week may offer an entry into this beast. Still have no idea what they do.
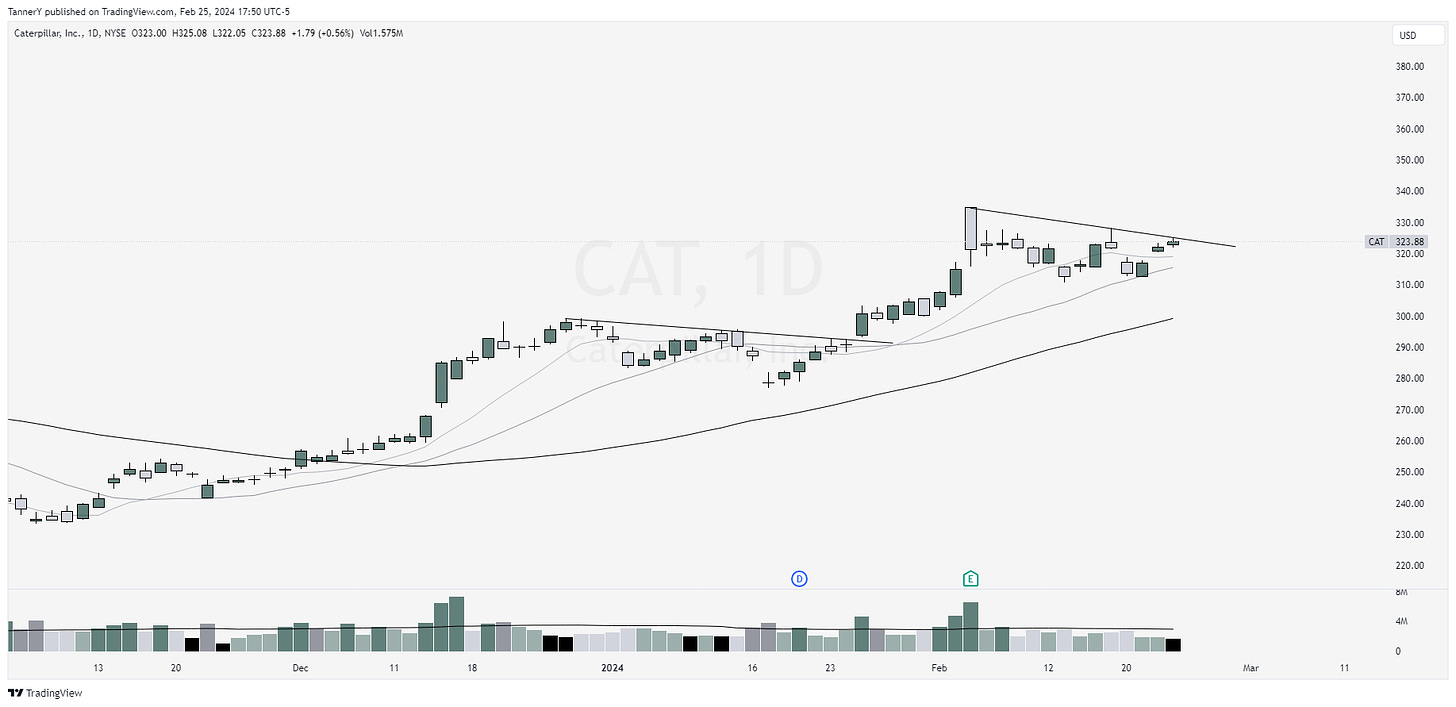
CAT 0.00%↑ with a clean setup. Top sector being XLI, so I could see this moving with its pack. That’s all for this week!
IF YOU ENJOYED:
Like this post



Do you have a guide to reading this for beginners? :)
Great read!