Introduction
Investors,
Hello and welcome back to another volume of Charts, Trades, and Analysis! For those unfamiliar with this newsletter, every week I go through the markets indexes, my opinions, the performance of the stocks I post about, as well as up and coming charts and ideas I am looking forward to in the next week.
If this is content you enjoy, don’t forget to subscribe, as well as leave a like on this post to help grow the page!
Indexes
Last week we saw slight up trending price, but digestive under the hood. Spy gave minimal opportunities for longs, and swings have been brutal. I definitely got caught off sides a number of times and struggled, but ultimately this has been healthy, and the tune has not changed quite yet.
While many believe mega cap top is in, I remain adaptive to the environment in front of me, and until I am being showed otherwise, nothing changes for me.
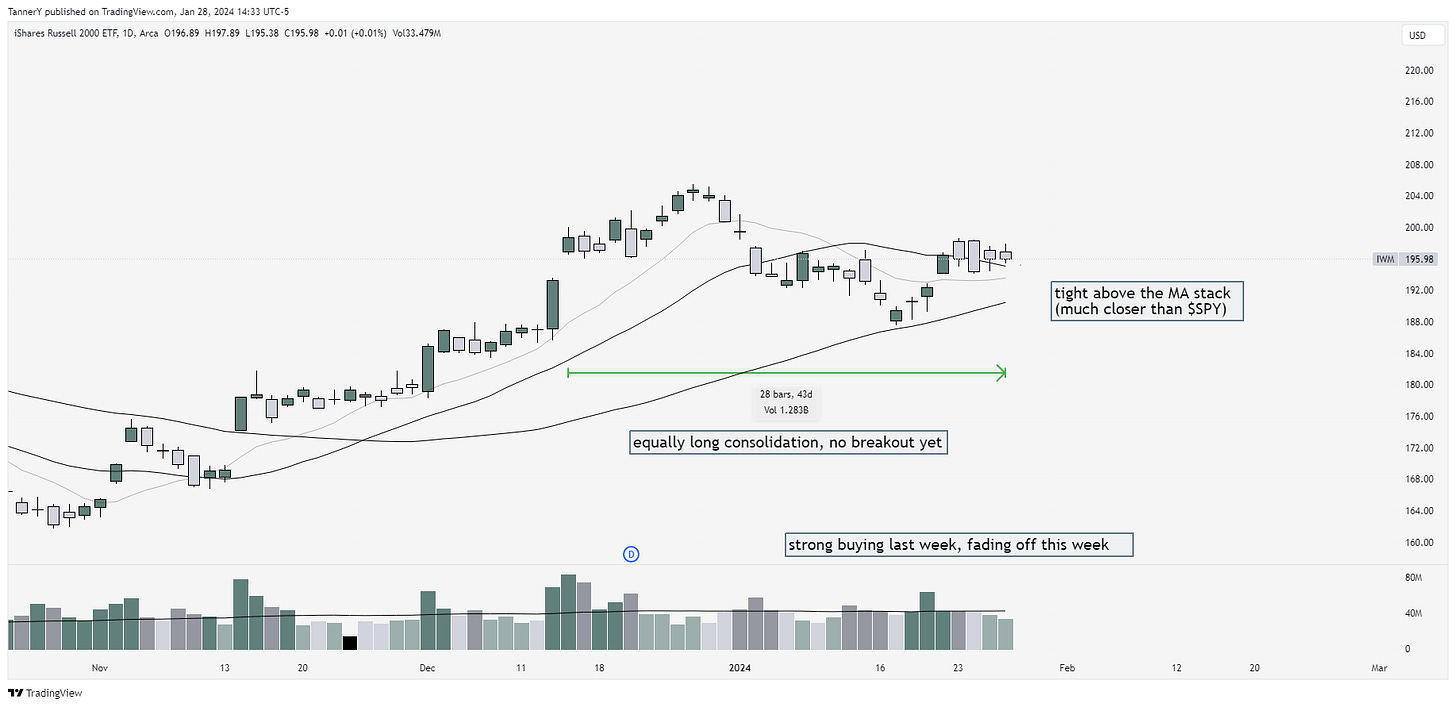
As we look into the indexes, I can see the thesis for a bearish week ahead, but also just clean digestion and rotation. see below:
As it can be observed on the annotations, SPY 0.00%↑ recently broke out of a 1 month long pivot from December. Will we look to retest here?
IWM 0.00%↑ has been a primary focus of mine for quite some time. It holds many of my favorite trading stocks for equity, and I think it looks healthier than SPY. While yes, IWM has been underperforming in the last few years, I think many of its holdings put in highs in December, and now they are ready to begin to move higher. Since SPY gains are all attributed to the same handful of stocks, this also puts IWM on my radar as a more realistic index.
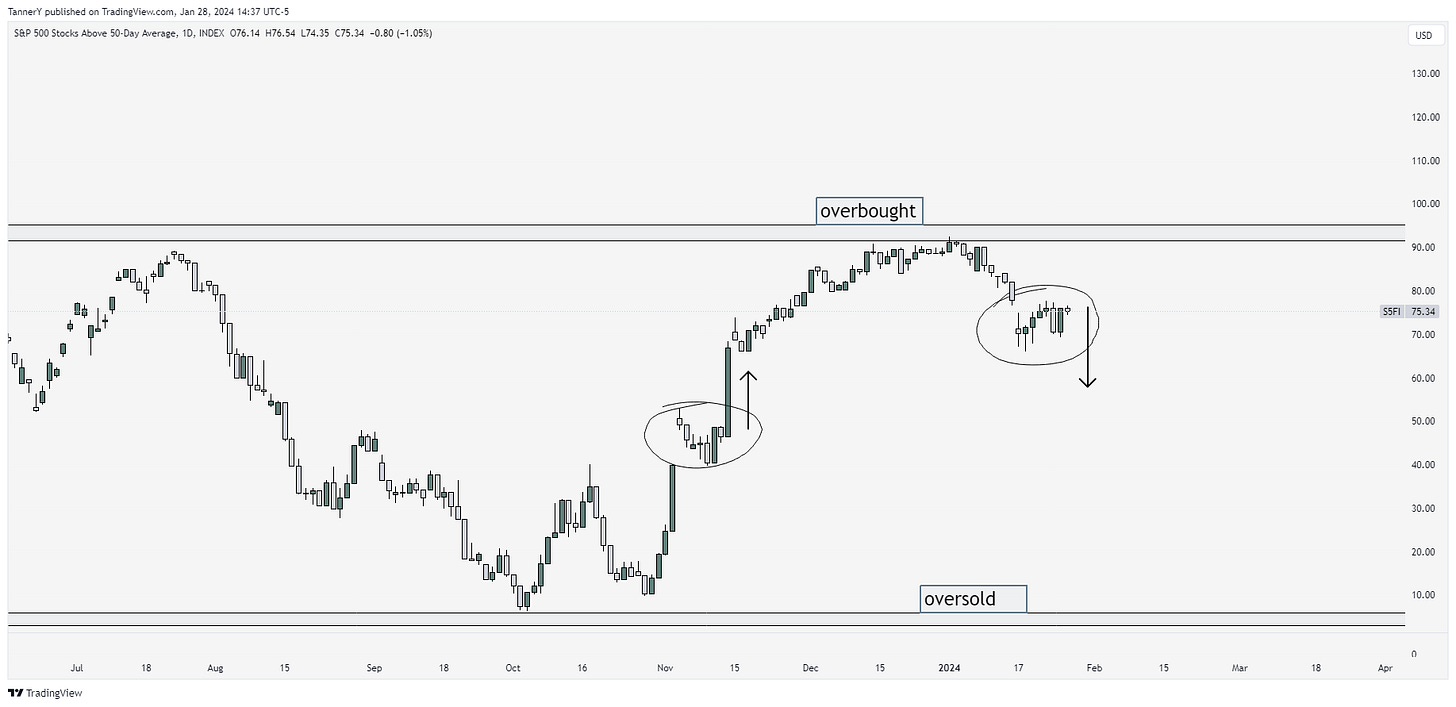
As we move into the market gauges, the S5FI gives us a clean look. These gauges generally are not perfect indications of market direction, but helps visualize the health of the undercarriage.
Parabolic Trend Analysis
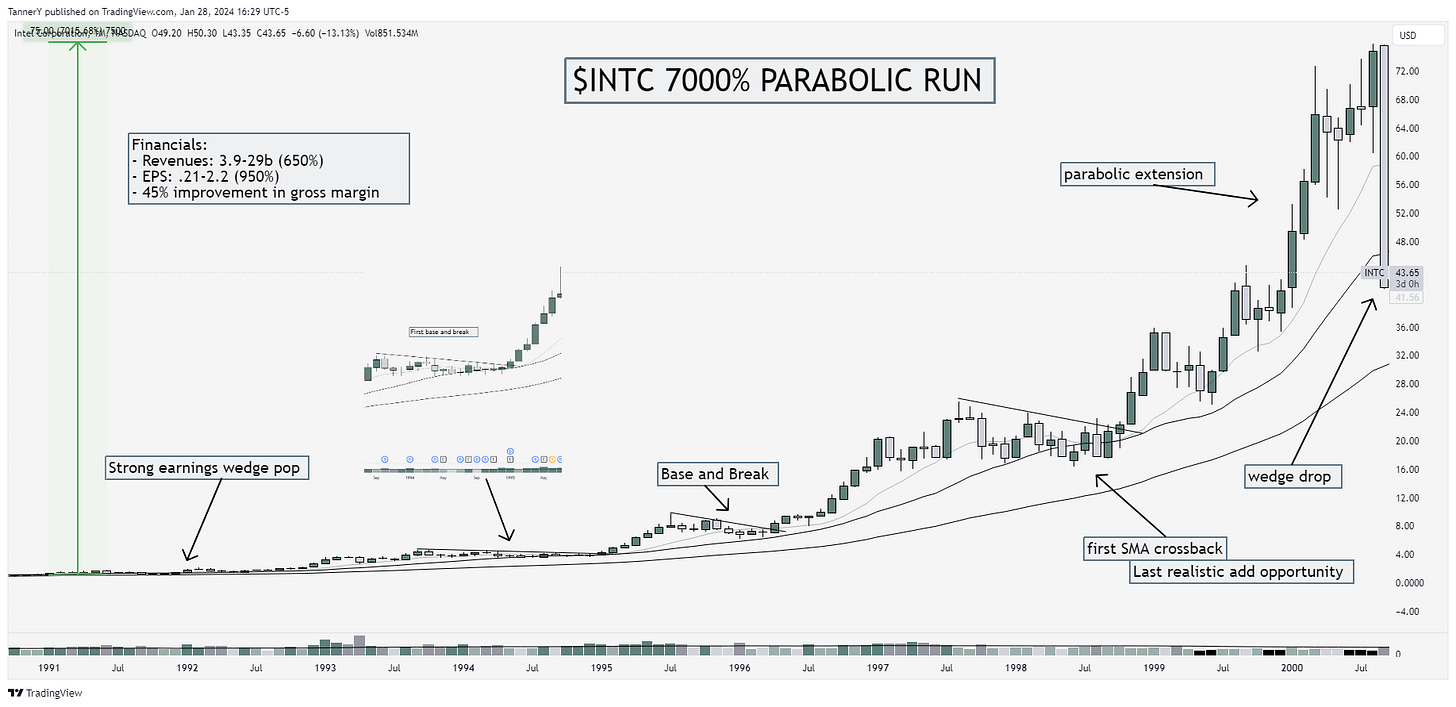
This weeks Parabolic trend analysis is INTC 0.00%↑ 7000% gainer during its .com bubble rise. INTC 0.00%↑ at the time was a true market leader, before the meteoric rise of AMD 0.00%↑ and NVDA 0.00%↑ .
Unlike some of the other parabolic moves we have seen, I think a huge contributor to gains here was INTCs improvements in margins despite extreme growth in such a short period of time. Keeping margins healthy when growing the business is paramount in reassuring shareholders that the moat is still strong.
Past Performance
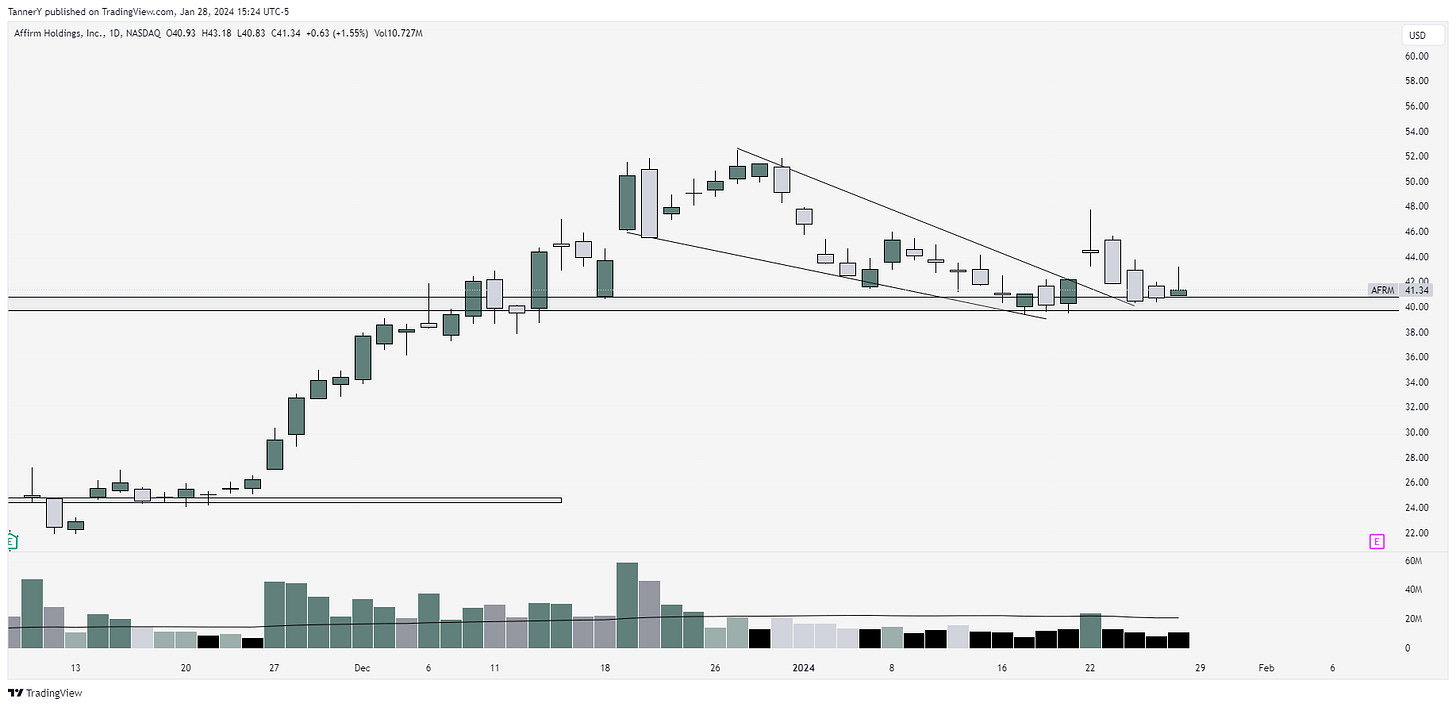
One of the main caveats of this portfolio is that purchasing a Monday morning gap up can set an ill tone for the week. MDB 0.00%↑ and AFRM 0.00%↑ fell victim to this. Both broke out of the respective setups I had drawn out last week, only to fade for the rest of the week.
Charts
Lets take a look at some of the charts for this week:
AFRM 0.00%↑ up first again. If IWM 0.00%↑ digestion is over, and a move is afoot, AFRM has a great look to it for continuation upward
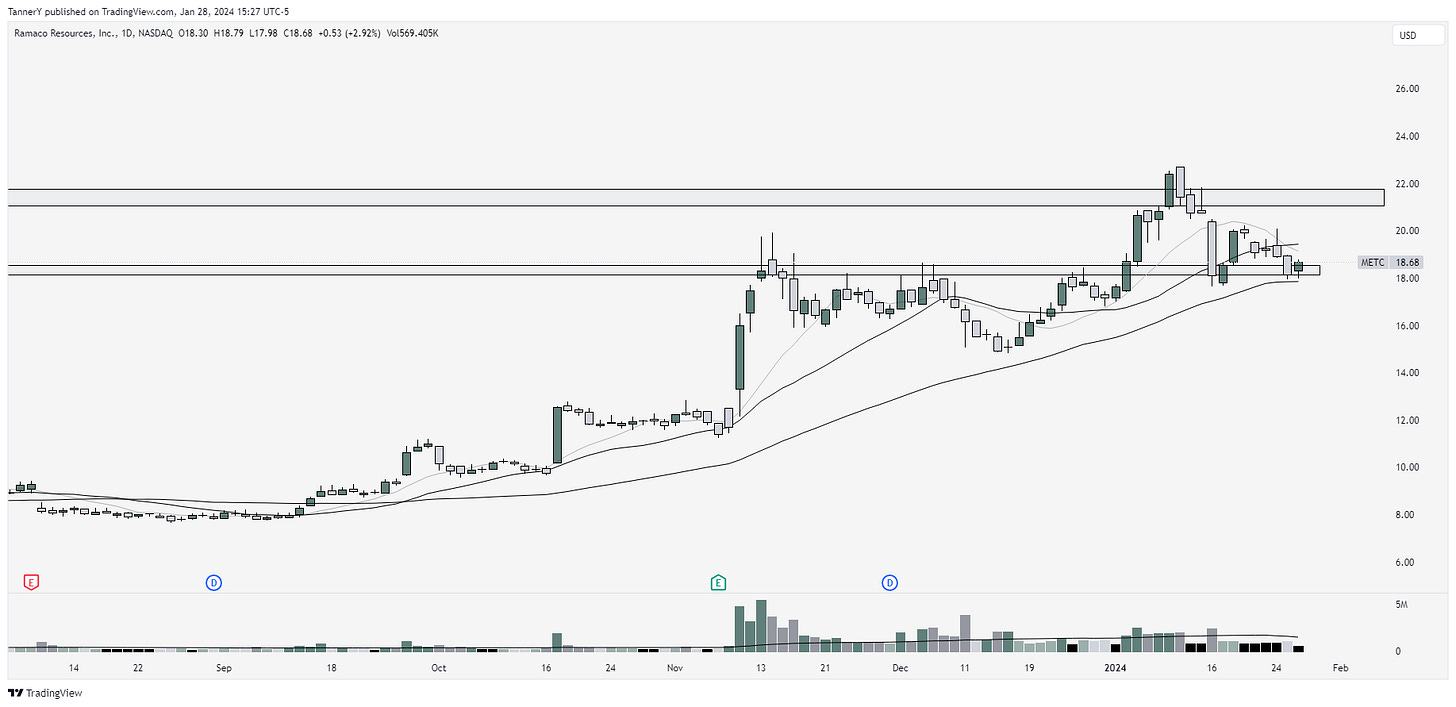
METC 0.00%↑ strong move after earnings last season. Pulling back into moving averages and caught between two powerful pivots. Looking good.
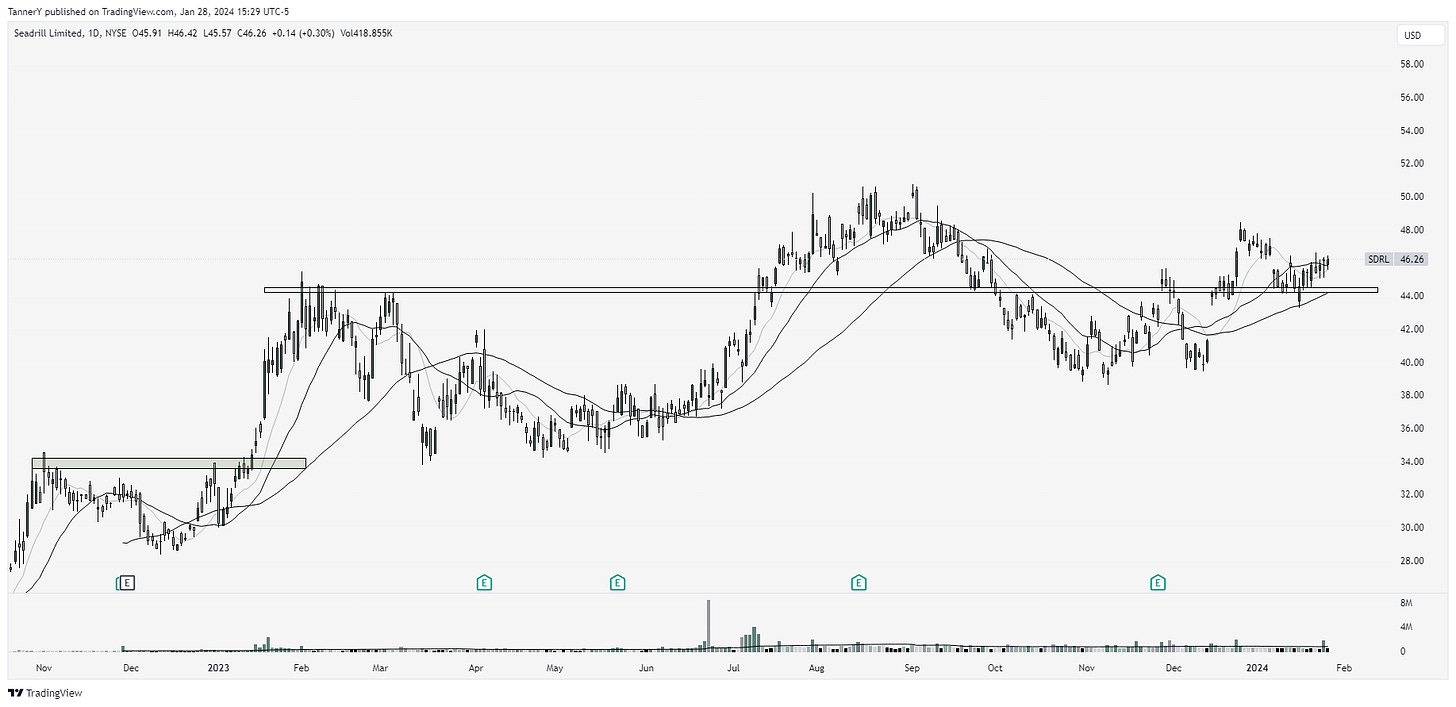
SDRL 0.00%↑, the energy theme is heating up, and SDRL 0.00%↑ looks best in class.
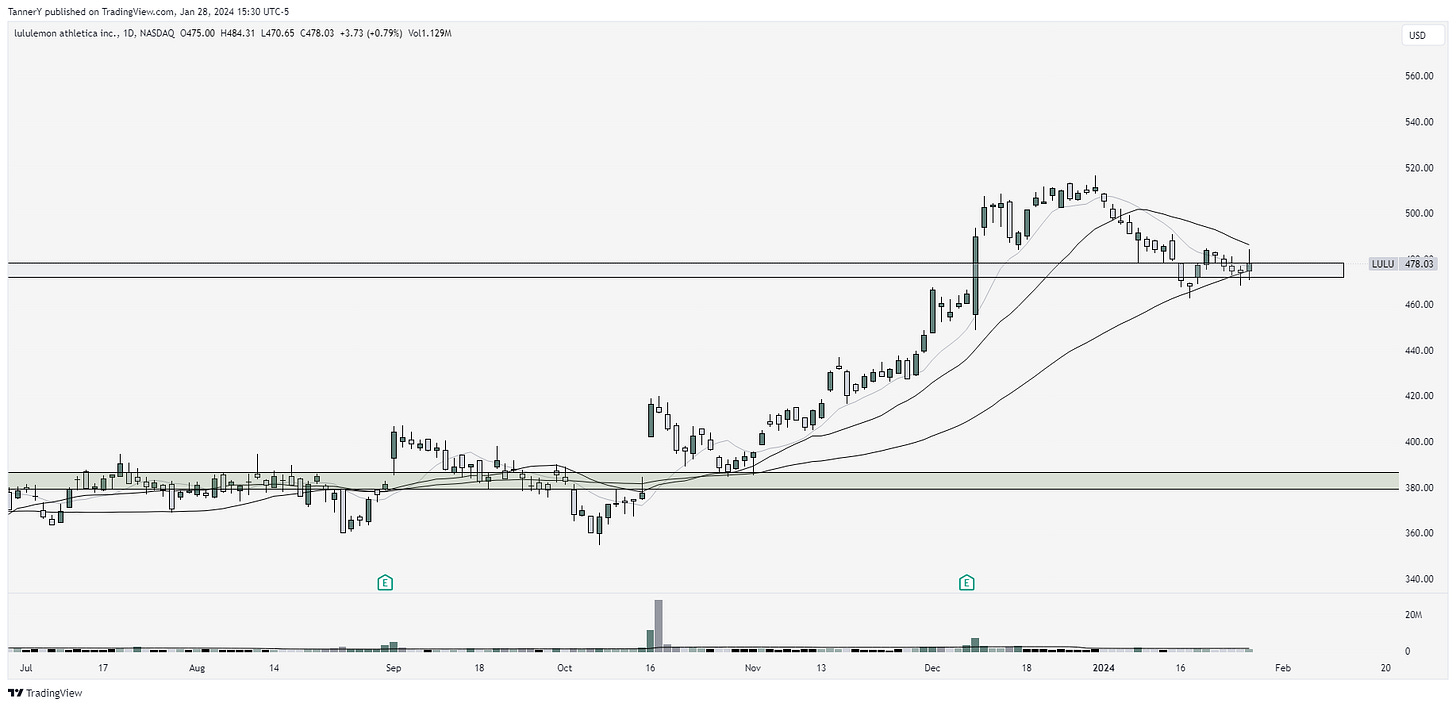
LULU 0.00%↑ pulling back to 50sma as well as previous all time highs. First pullback to 50sma in a run is usually a continuation mover.
That’s all for this week!
IF YOU ENJOYED:
Like this post


