


Stock Setups for Dummies
Repetitive Setups In Market Bottoms: An Analysis

Introduction
Stock trading during broad market downturns is inherently difficult, especially with the variety of technical patterns and setups to choose from. However, when a market draws down, indexes tend follows one of four types of bottom: V-Shaped Recovery, Double Bottom Bounce, Higher Low, or standard pullback. These environments, while seemingly harder to trade than an uptrend, often presenting predictable patterns in top-performing stocks.
Abstract
Leadership stocks that bottom together tend to run together. This article will analyze four market bottom structures, showing how individual leadership stocks react to each, with examples from SPY and associated leaders. External factors like news or environmental impacts on leaders will also be addressed.
Understanding broad market bottoms
What is a broad market bottom? A broad market bottom is the end of a bearish trend. Similarly to an asset going parabolic (slow buildup into vertical takeoff), this can happen in reverse, with a slow breakdown into capitulatory selloff marking a near term bottom.
Below is a comparison between SPY recent capitulatory sell into tariff-mania, and MicroStrategy (MSTR) parabolic blow off with Bitcoin run and hype.

As we can observe, this type of bottoming is violent. The downtrend is observable in the broad market before a series of headlines or historically significant pivots get broken and capitulation ensues, just like the blow off top. I have inverted the SPY chart to better show the similarities between the two examples.
Another type of broad market bottoming is slower, with time consuming sequential lower lows into higher lows like we saw in 2022. This type of bottom is generally more akin to a stage 3 top (in reverse), without a defined “blow off”. See 2022 bottoming for example below:

The type of bottoming we saw in 2022 also came with a different set of reasons for trading down. Inflation was a long standing concern, the housing market had been overheated for some time, conflict was popping up all over the world, and equities were overpriced, historically. The culmination of these factors led to a more rounded bottom, as the market was void of surprise, unlike the recent downturn.
Where the types of bottom differs is how it can look towards the end of its trend, at the start of the uptrend. This is where the opportunity on the long side starts to materialize in a cohesive way, bunching together the same type of opportunity on a variety of instruments. Lets dive into the different bottom structures and the leadership names reactions at the same time below…
Double Bottom Bounce
The double bottom bounce on broad markets most frequently brings us higher low and flat top base structure breakouts. Ive found that immediately identifying stocks that are able to put in higher lows while SPY digests down to the previous is a foolproof show of strength and really needs no additional technical setup besides breaking the range high. Many examples to follow…
2016 Double Bottom Bounce Example:

As you can see, the leftmost selloff on SPY in 2015 is a capitulating sell, which makes a marginal recovery before coming back down into the lows to retest a double bottom. Lets observe a series of leaders during these periods of time:
NVDA Higher Low Example:
As we can see, NVDA was a market leader during this period of time. While SPY put in the double bottom, NVDA put in a higher low and flat top base which continued much higher much faster than the broad market.
META Higher Low Example:

The key here is noting the consistency of leadership names in how they act around different broad market events. The double bottom is most associated with higher highs and flat top base breakouts for leaders.
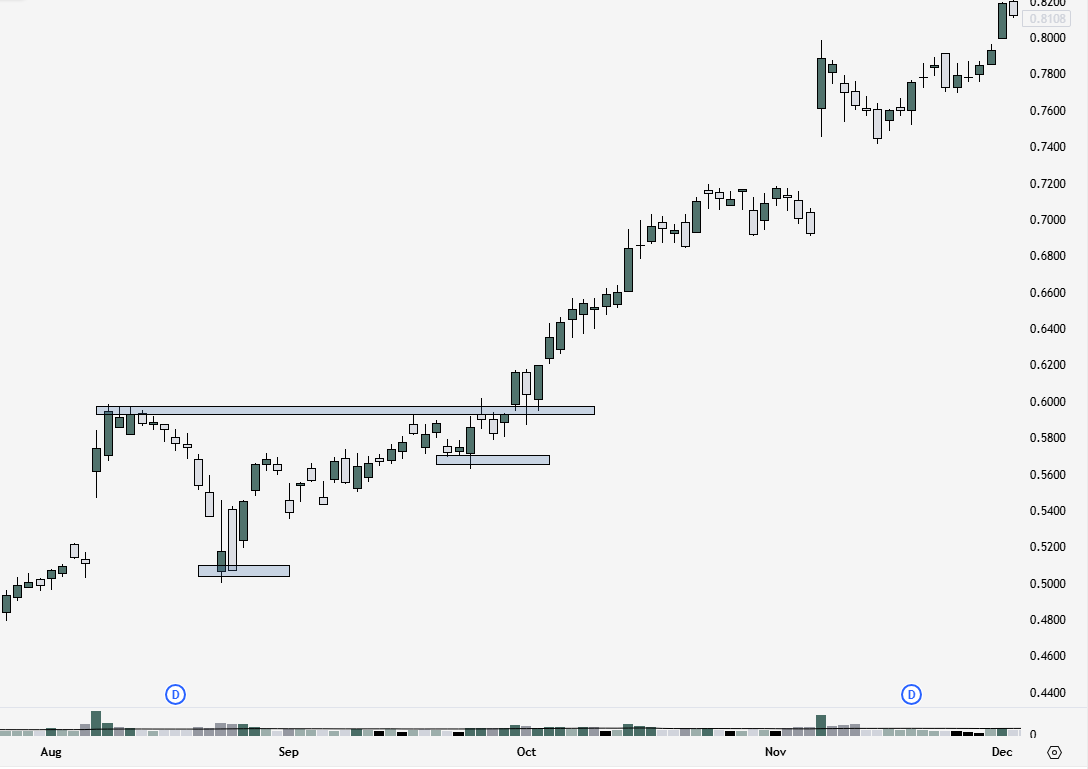
2022 Double Bottom Bounce Example:

Seen above is SPY, putting in a relative double bottom.
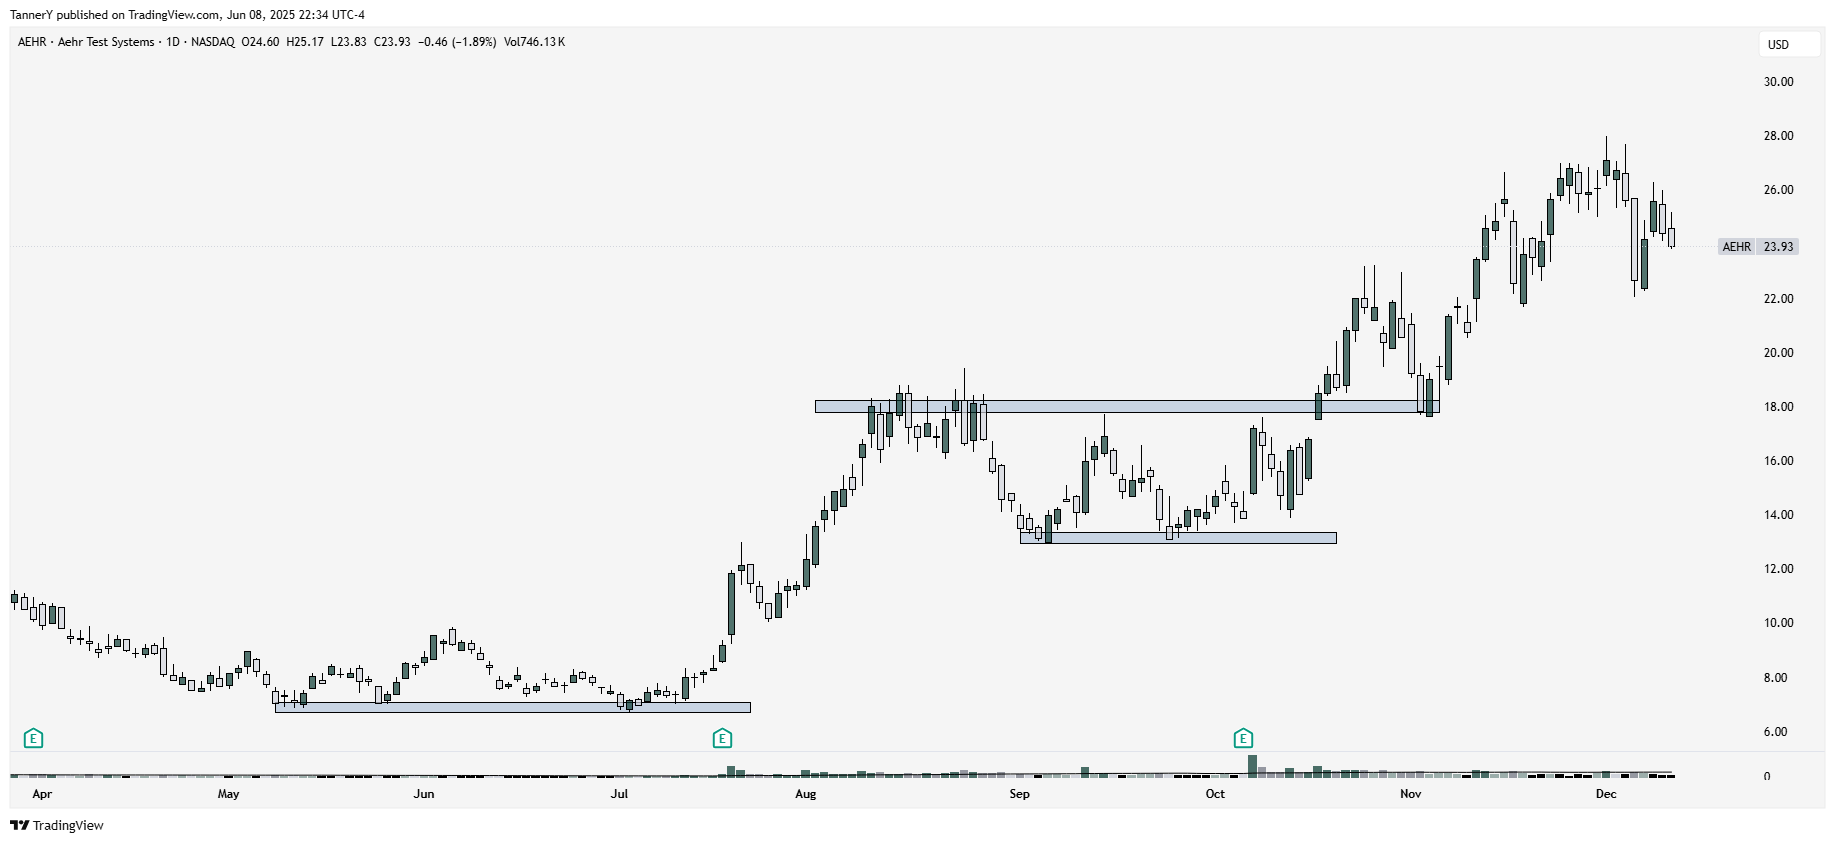
AEHR Higher Low Example:
Below we have AEHR 0.00%↑, a leader at the time. Similar to the 2016 price action we can see higher lows and a flat top base breakout.
CROX Higher Low Example:
In another example below we can see CROX performing the same thing. Higher broad structure low than SPY putting in a double bottom, then a flat top base breakout.

V-Shaped Recovery
Furthering the work here, lets take a look at some broad market V-Shaped Recoveries and leadership stock reactions. In this type of environment I most commonly see cup with handle style setups appear on leaders.
2020 Broad Market Example:

Probably the most famous V shape recovery in recent history, the 2020 Covid-19 crash was quickly usurped by rates at 0% and government stimulus.
MRNA 2020 C&H Example
During this time, the leadership names either ripped right through previous highs, or set up cup and handles at said highs. The best example is MRNA Moderna, putting in a shallow low in March, and a premium Cup and Handle in May. Observe:
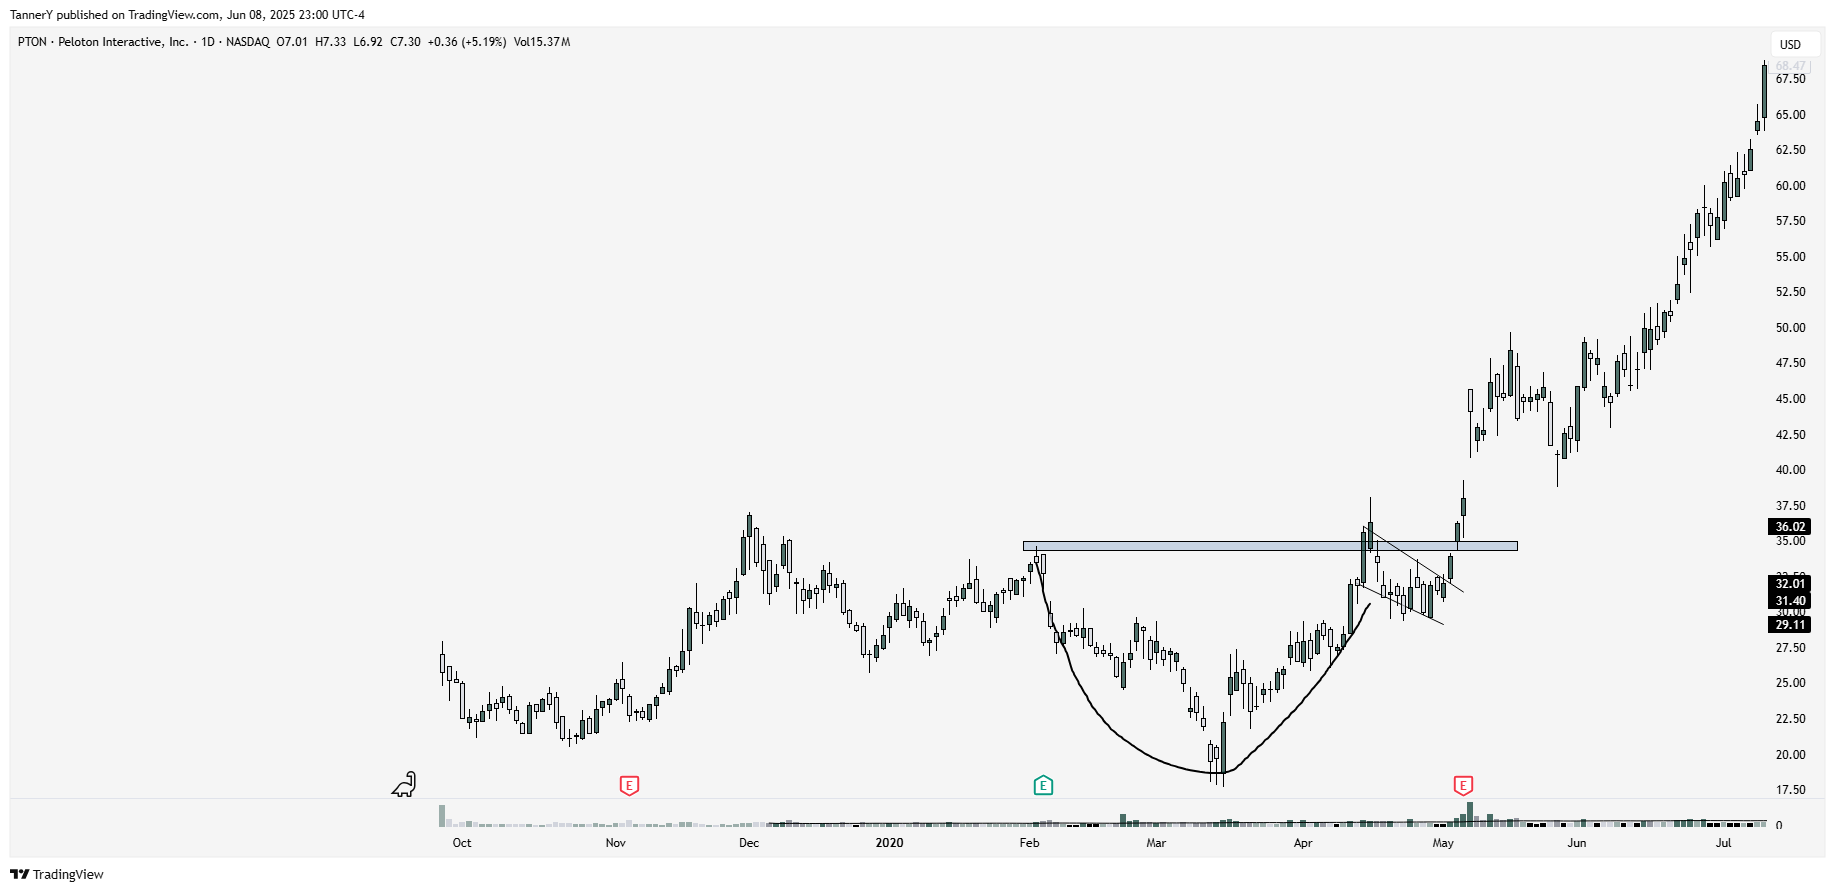
As we can see, it reflects the shape of the SPY C&H, however SPY is still far off highs in May while MRNA pushes them with ease.
Sea Limited C&H Example:
This is a very standard look from the time period, see SE below:

SE: Sea Limited one of the premier leaders from 2020 saw the same action, with an extremely rounded bottom in march straight into a high velocity C&H in April.
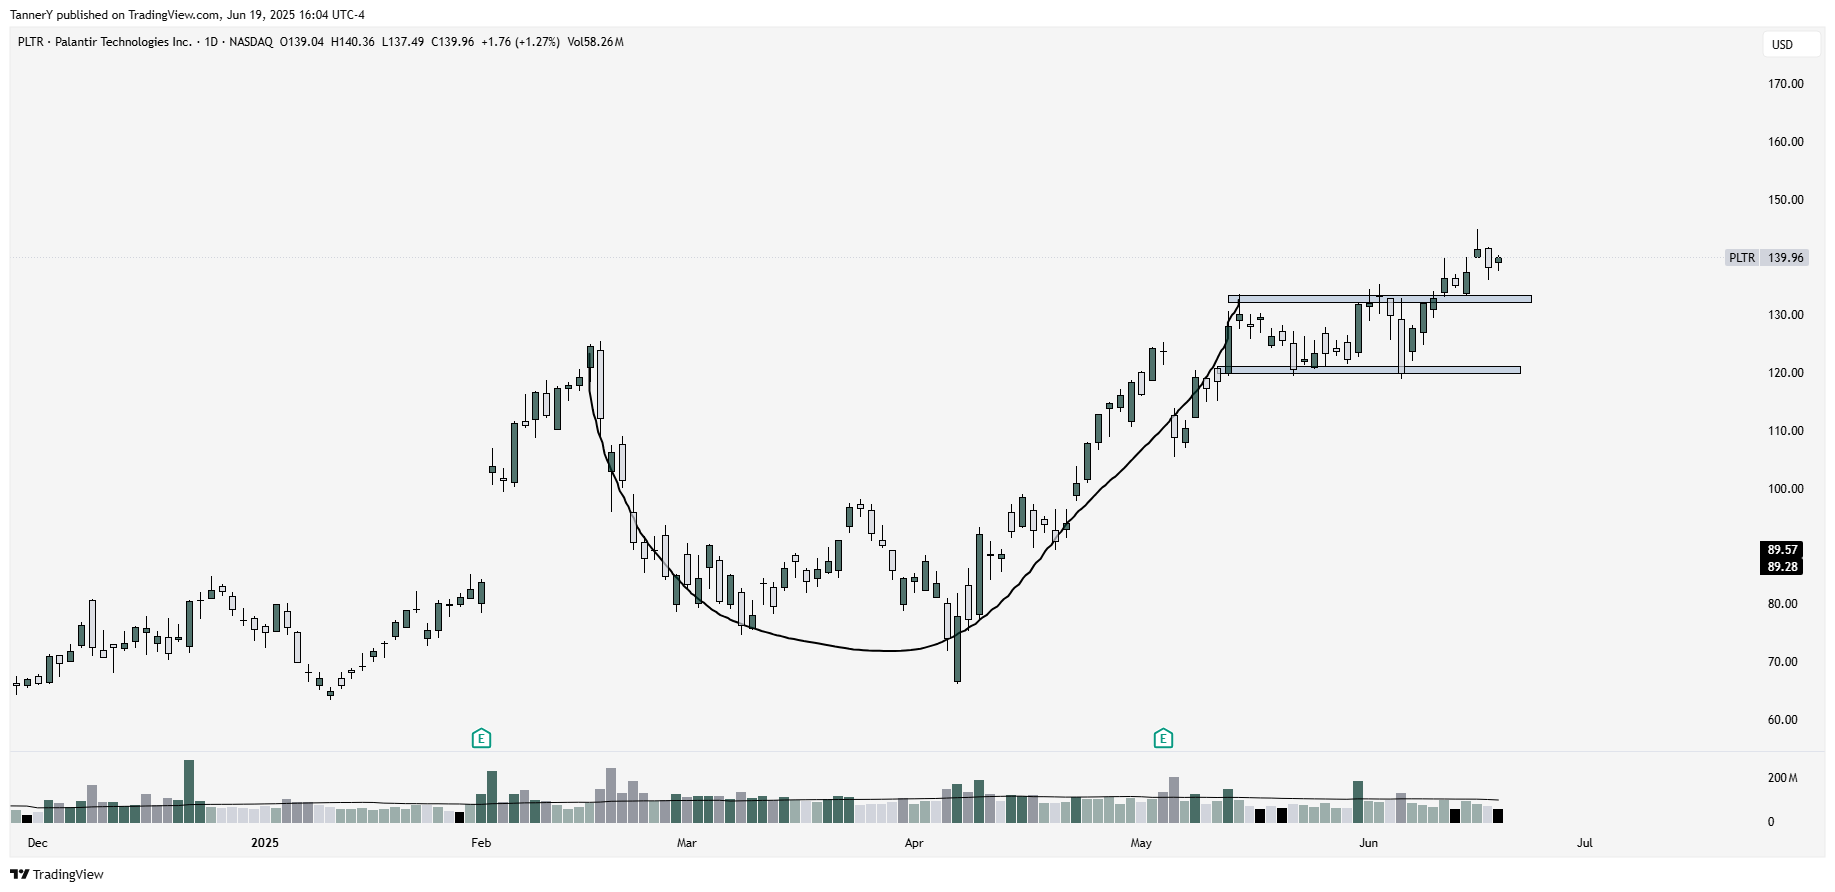
Palantir Cup 2025 Example:
PLTR is undoubtedly a leadership name in this tape. With broad markets making a V shaped recovery back to highs, we see such a strong cup and handle the handle is entirely sideways.
Zoom Video 2020 Example:
ZM: Zoom video didn’t even bother with the March lows. Began running before broad market bottomed, put in the C&H and it was off to the races.

In all of these examples the leaders either made the C&H prior to the broad move down, or before broad markets actually recovered themselves. Noting this action early before ATH are reached is important to catch as many as possible. Lets move on to the next setup.
Higher Lows, Standard Base Breakouts
SPY putting in standard pullback action on higher lows, expect individual leaders to be out and away base and breaking out. Laggards may be cup and handling here, but true leadership will be out and away.
SPY 2021 Higher Low Structure:

As you can see SPY is trending upwards, however higher lows after selling is crossing below SMAs. Leadership stocks will be respecting SMAs here and putting in clean base and breakouts.
Texas Pacific Land 2021 Base and Breakout Example:

Note the cleanliness of the top performing SP500 component. Surfing SMAs, textbook base and breakout setups.
GOOGL 2021 Base and Breakout Example:

As we can see, the setup is very similar here to TPL, where GOOGL is not only making higher lows, but also consistently base and breaking in a much cleaner fashion than SPY grinding upward.
In all of the above mentioned examples we see relative strength in leadership, with the strongest aligning with each other to form the same technical patterns out of the downturn. For the bulk of 2022, the action was grindy, without much headway made. In environments like this, leadership tends to appear in wedge pops and gaps on volume, in an Episodic pivot style run. The reasoning behind this is to outperform a grinding or slowing market is to shock price with some form a catalyst, such as the announcement of a buyback program, topline sales growth, global supply crunch, guidance raise, or government funding. Below are some examples of leadership names that met this criteria in 2022, kicking off their run with the EP.
SMCI 2021-22 ATH EP Example:

As we can see, despite broad market topping, SMCI manages to EP to fresh highs, and begin the second leg of its uptrend despite grindy broad market price action.
IPI 2022 Ukraine Invasion EP:

When Russia invaded Ukraine in March of 2022, a global supply pinch was put on phosphorus, a key resource used in fertilizer. Leadership stocks at the time EP’ed off this news, and saw significant linear moves based on the news. At the time, SPY was grinding sideways with no clearly defined direction.
I often find that these trades are fewer and far between in a year like 2022, and not mutually exclusive to grindy price action, however they do work best in these environments as there just isn’t much action, so any can lead to large liquid moves higher. Another example of this was the shipping crisis in 2022, which saw tanker stocks soaring as a group, all spurting huge volume and rises from the dead of downturn through the previous few years.
Conclusion
While all of this information is helpful in identifying similar leadership action through broad market downturn, it is important to recognize that without proper structure, its all for naught.
There is no way to effectively gauge risk reward through downtown and whatever news deemed it so, however, we can look for certain repeatable action in leadership to guide the way. The simple note I keep on the desk during times like this is as follows:
V-shape recovery broad markets -> cup and handle
Double bottom broads -> higher low flat top base breakouts
Higher low broad market -> standard base and breakout setups
Broad market chop/grindy directional movement -> wedge pop reversals and gap buys
Thank you all for reading. If you enjoyed, like and subscribe.
Here’s the rest of my socials:
Bottoms come in different shapes and sizes, and we love them all. Seriously, good work, Tanner. Clearly you did a lot a lot of research putting this thoughtful piece together. It's like a primer.
Good chit as usual Tanner.