How to find exits and stop losses on stocks: An introduction
By: Tanner Yarton
Introduction:
Hello Everyone,
Welcome back to another article in my education series. In this, we will be going over the stop loss and why it’s so crucial as investors to know where the stops are before entering a trade. In addition to this, I will cover how to determine a stop-victory if there are no upside targets to go off of.
I cannot stress enough the importance of recognizing sell points before entering a trade. Everyone’s trade should be like a map, with different turns on the road that lead to different outcomes and solutions, all drawn out before you embark on the journey. Utilizing a trade plan and rule set to assist in actively managed portfolios greatly reduces the guesswork and confusion that can come when a stock starts to run or breakdown.
The Stop Loss:
Touted ‘Big Short’ investor Michael Burry has gone on record saying he likes to invest in companies that have a particular “ick” factor to them that deters the average investor. He believes that there is hidden value in what is people just simply don’t want to think about, such as jails and drug businesses.
Stop Losses are very similar to these sectors Michael burry believes are valuable. No one wants to think about them, or their positions going down, but ultimately this is inevitable and proper stops should be utilized to improve the efficiency of your portfolio, the same way Michael uses these stocks others disregard to add value to his.
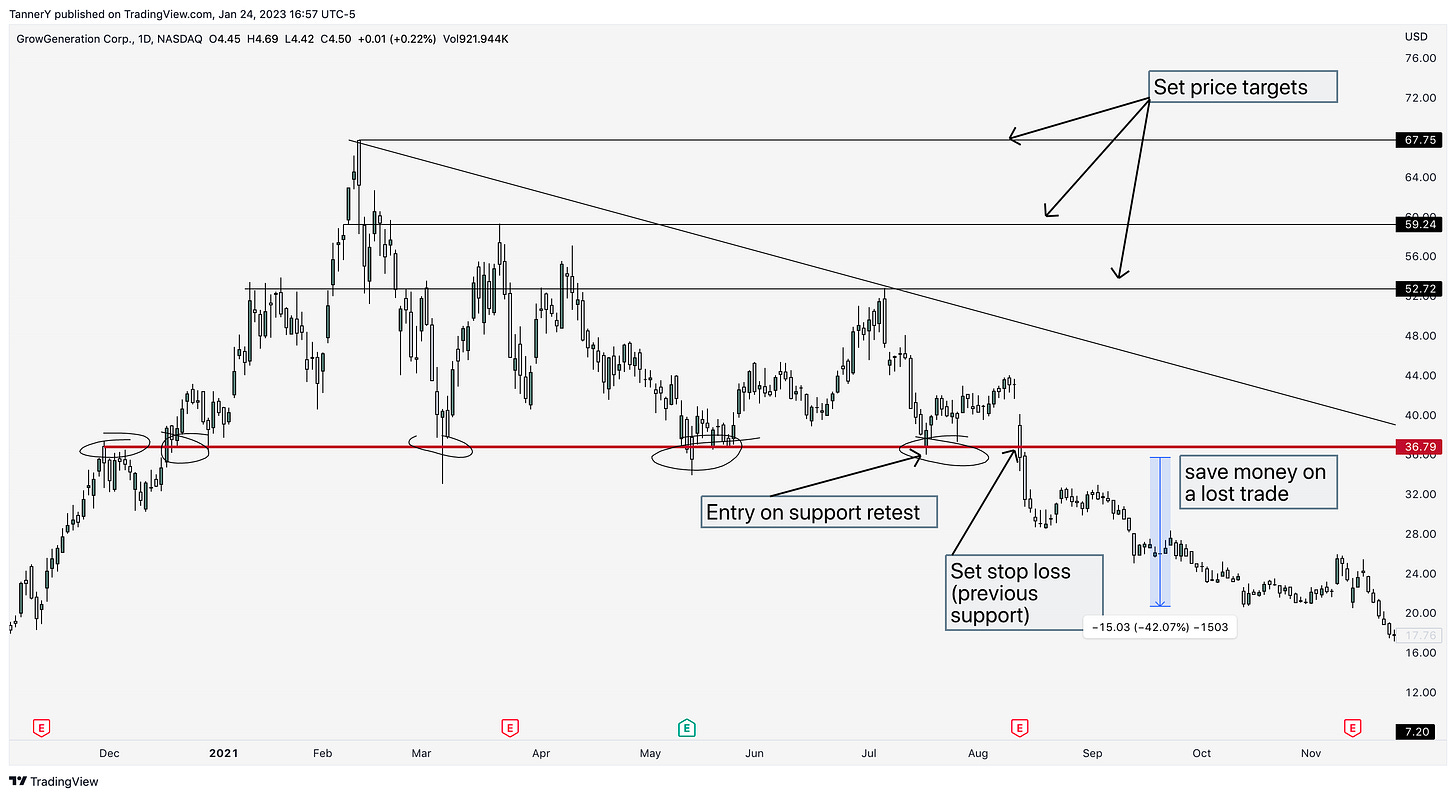
Below is an example of a simple stop loss on a chart to open the discussion. Annotations are posted overtop:
As we can see this is a pretty standard flag trade. We enter on the support (36.79) for the best risk-reward and set our price targets and stops accordingly. A close below this strong support (5 historical tests, red line) would indicate a loss of pattern and a cut of the options/equity. A breakout of the wedge would indicate areas to begin selling.
In this case, the position was cut. My first price target was 52.73 and despite the support holding for a number of weeks it was not able to hold after a lackluster earnings report. Knowing where my stop was allowed me to quickly exit the position and save myself an additional 40% drop in the coming weeks.
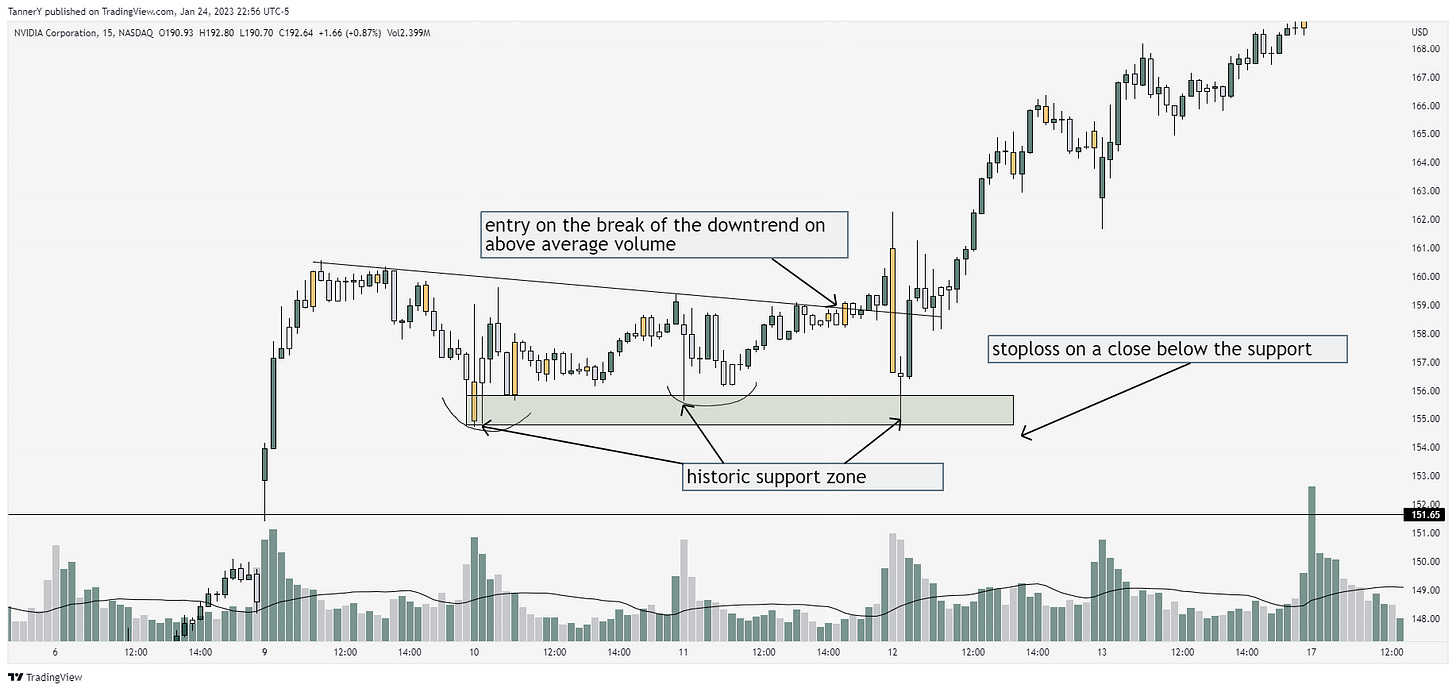
Another example is below with NVDA 0.00%↑ last week:
to go along with the annotations, here’s some notes:
- Always let the candle close. If you entered on a 30 minute setup, exit on a 30 minute candle after it completely closes.
- depending on the strength of the bounce off the stop loss zone/level, it may become and add zone.
Exit Management:
Exit management is a set of rules I personally follow when i’m exiting my equity longs, but it can be good for options and other smaller timeframe trades as well. Oliver Kell calls this the ‘wedge drop’ but I like to think of it as a knife through the moving averages.
here is an example with SMCI 0.00%↑ this week:
As you can see, this stop hit the day after I entered the trade. Unfortunate.
Here is another example in UTZ 0.00%↑
Heavily annotated chart.
a key note to remember, when using the moving averages as a stop instead of a zone/level, you can really get a nice runner out of a chart. As long as its holding the trend and continuing to make higher highs and lows without getting too extended too fast, I like to leave a running position.
Closing Notes:
To wrap this article up, Id like to reiterate the importance of a stop loss based on the chart, not any contract gains or losses. We are trading price action at the end of the day, and simply using options as a means to a more leveraged end.
If anyone has any questions, feel free to message me on twitter, HERE.
If you liked this content, share it with a friend and like the post so I know you enjoyed it.
Tanner


