Beginner Guide: Essential Vocabulary, Pro Tips for Account Setup, and More!
A Comprehensive Guide to Mastering Trading and Investing Basics
Investors, noobs, and enthusiasts alike,
In this special edition of my newsletter, Id like to give a breakdown of how to go from minimal trading or investing knowledge to being able to navigate my newsletters, tweets and content like a pro.
This may not apply to many of you, but for those who are looking for an all-in-one comprehensive guide, this is it!
Brokerages
Your brokerage account is where all the transactions, trades, or investments occur.
Definition: intermediary who makes matches between buyers and sellers of stocks, bonds, and other financial assets.
Platforms for beginners (US BASED):
For a more professional experience (US BASED):
For users OUTSIDE THE US:
Interactive Brokers (depending on country)
Types of Brokerages
At some point in the brokerage setup, there will be a question that asks whether you want a cash or margin account. Cash accounts have unlimited day trades, but after all the cash in the account is used (not lost), you have to wait for the funds to settle to use them again. This can take up to 48 hours.
With a margin account, you always have access to funds, but after 3 day trades in 5 days you are blocked from day trading until the flag is lifted (5 days from first day trade).
Cash Account: A cash account requires that all transactions be made with available cash.
Margin Account: A margin account allows investors to borrow money against the value of securities in their account.
Charts and Scanners
Once you have an account setup, its important to be able to view the different stocks available for purchase and trading. For this, I have done extensive research over the years to find what I believe to be the best platforms.
Free charting options:
TradingView (https://www.tradingview.com/)
ThinkorSwim (Link to ThinkorSwim)
Paid charting options:
Marketsmith (Link to Marketsmith)
DeepVue (Link to DeepVue)
Free Scanner:
Finviz.com (Link)
What can we trade?
There are 3 types of trading that are primary in anyone’s toolbox:
Day Trading - High risk, high reward, quick entries and exits, mostly options
Swing Trading - Moderate risk, moderate reward. Patient entries, mostly stocks
Investing - In it for the long haul. Low risk, high rewards in time
What are we trading?
Stocks (commonly referred to as equity or shares): a share in the ownership of a company.
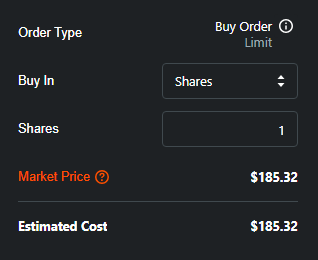
See below what buying one share of AAPL 0.00%↑ (Apple) looks like:
Stock Options: Options trading gives you the right or obligation to buy or sell a specific security on a specific date at a specific price.
What purchasing a stock option looks like on robinhood:
But what do the words I just said mean? below is an example of a trade I took recently:
Vocab Discussed:
Chart: A visual representation of the price movements of stocks and other assets in the market
Call: An option in which you are able to buy shares of a stock at a certain price as long as the underlying stock is above the strike by expiration
Put: An option that provides the right to sell shares of an underlying stock at a certain price within a time period.
Expiration date: The final selling day before an options contract becomes worthless or executed.
Strike price, or exercise price: The price at which an options contract would exercise on expiration day (what price you would buy or sell shares)
Premium: The price per share paid to hold an option. A single option is worth 100 shares, so if the contract is $0.75, the price is $75.00 ($.75*100=$75.00)
Last: The most recent price paid for the contract, also seen as ‘mark’
Bid: The price you’re willing to pay for a contract.
Ask: The price a seller is willing to accept for the option. if you’re selling contracts, its in your best interest to get close to the ask
Change: Nominal value change in the option from the previous day to this one, can be displayed in $ or %.
Volume: Total contracts traded on a given day
Price Chart Guide
What is a price chart anyway? See below:
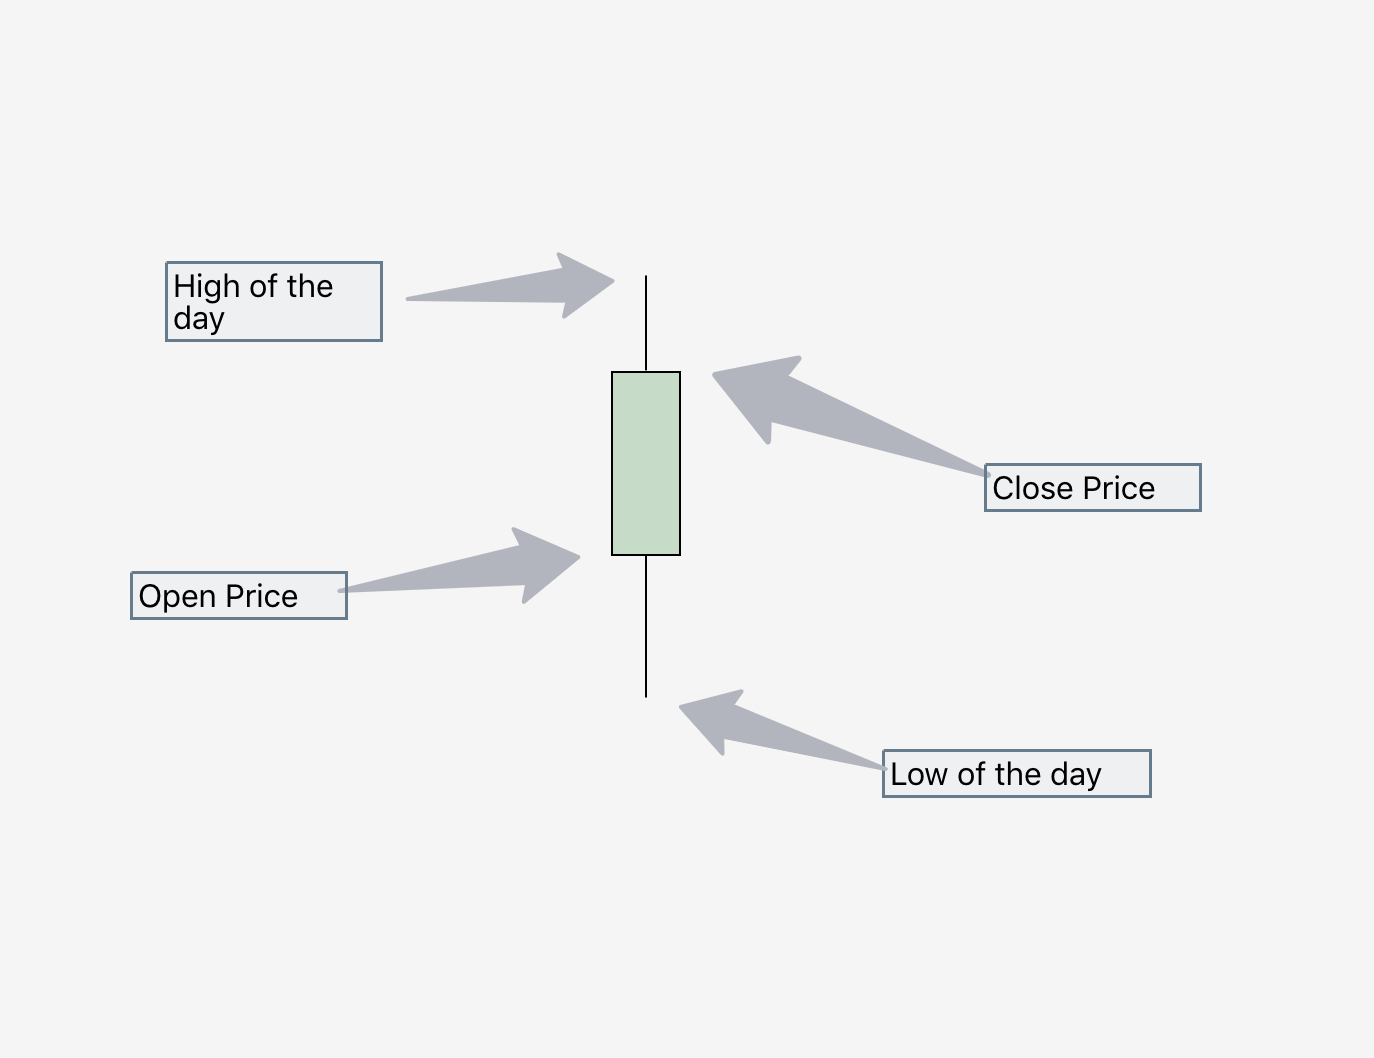
What is a candlestick:
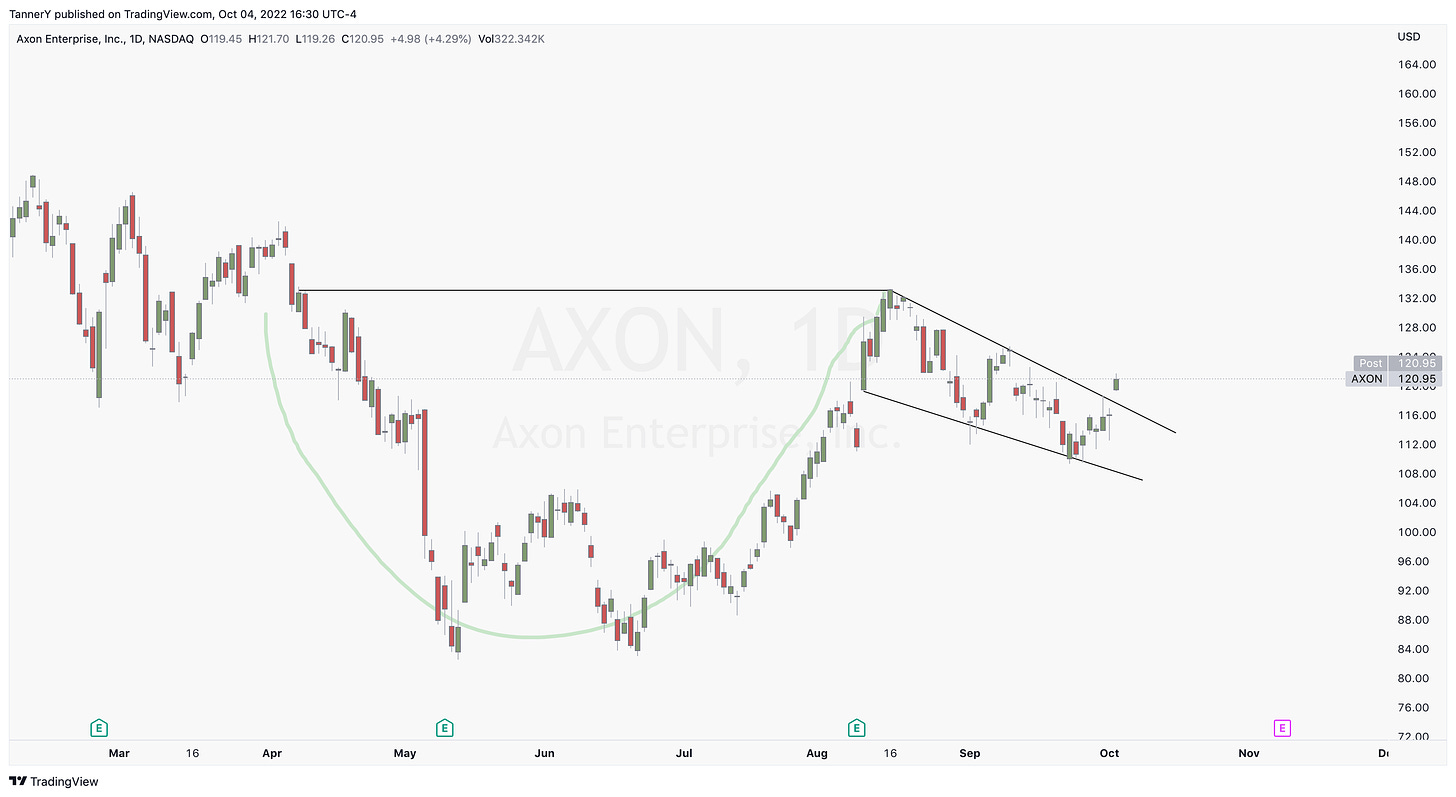
Patterns Guide
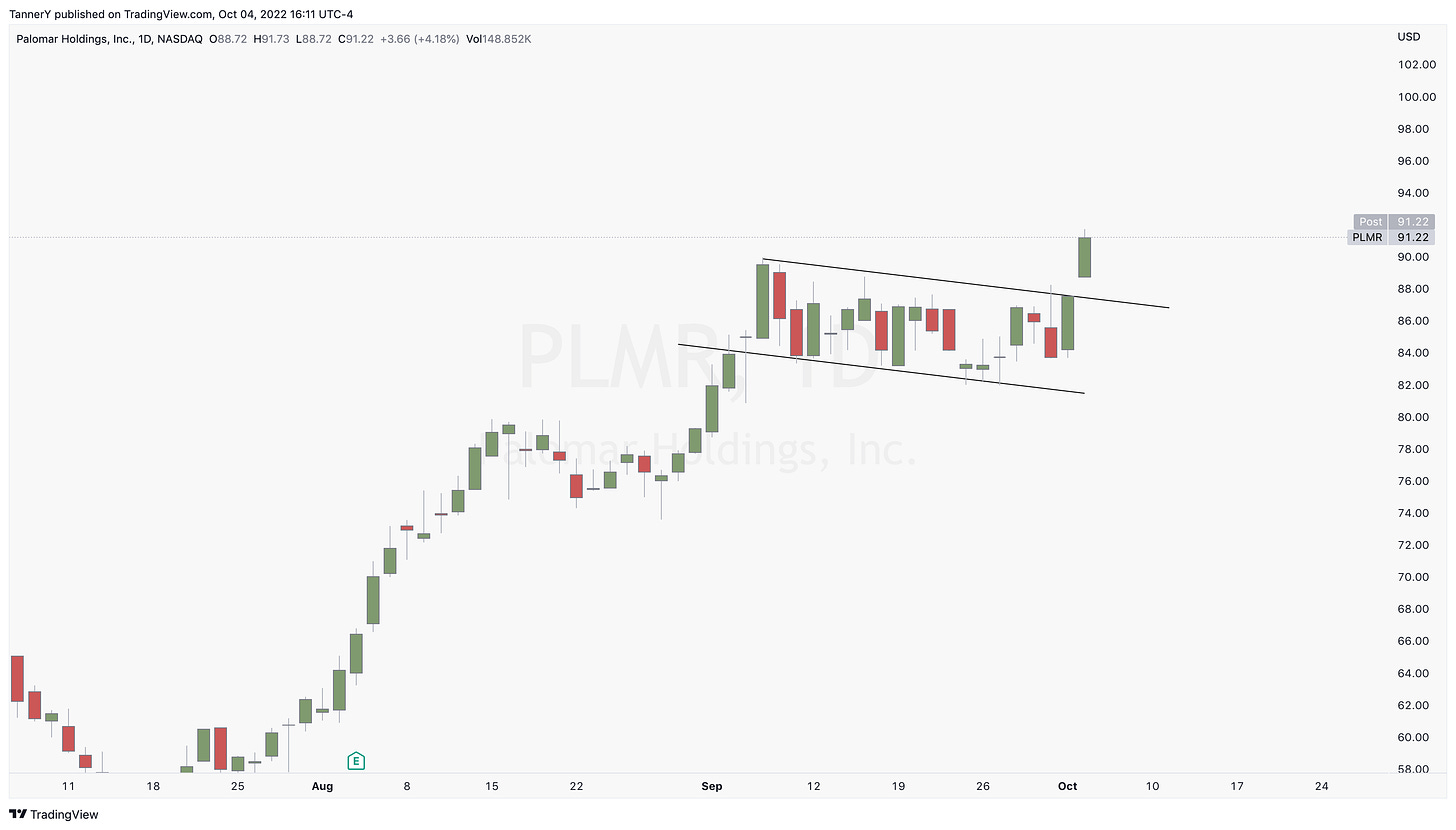
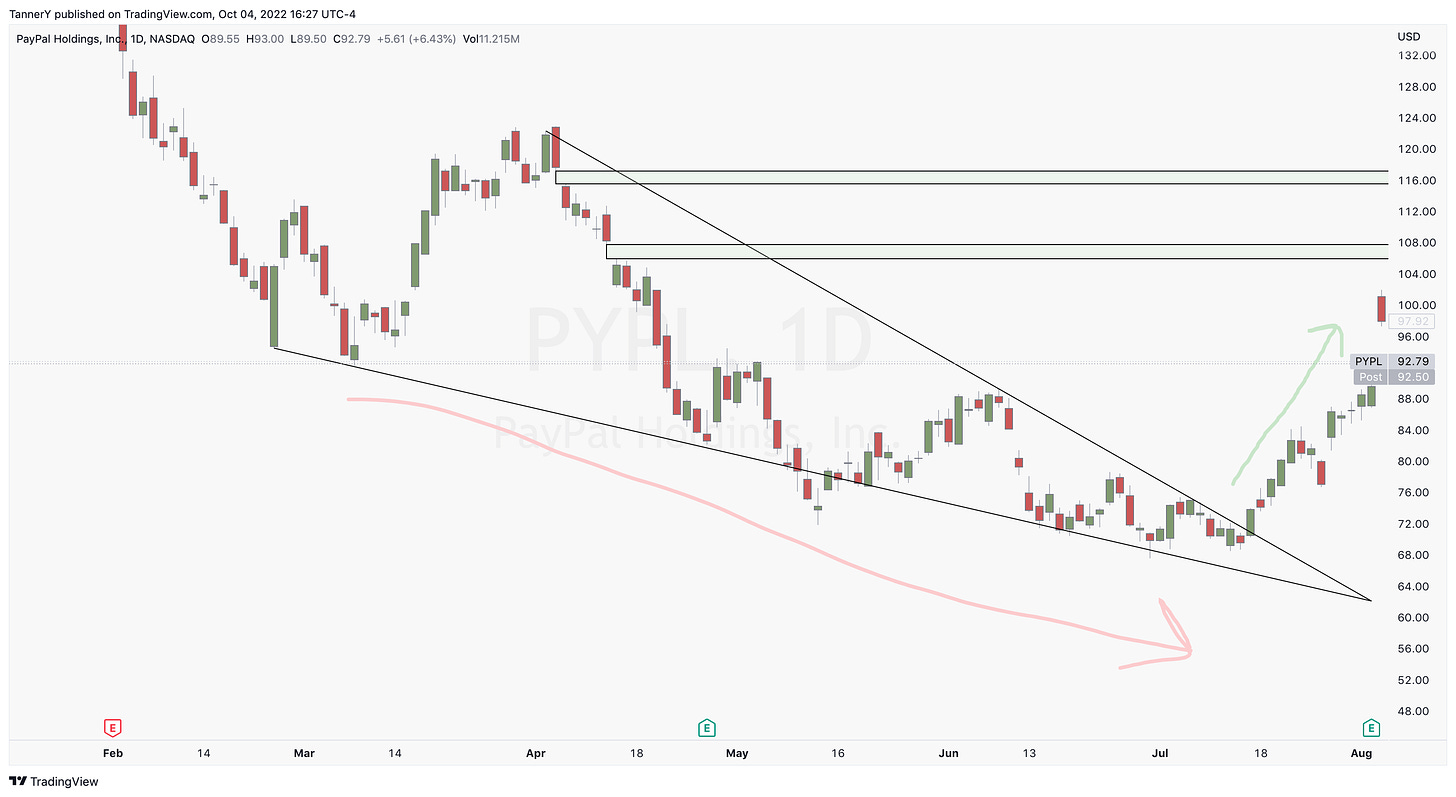
A pattern is when the candles are organized in a way that generally leads to one outcome or another. Below are some examples of price patterns.
Flag: A flag can be seen sloping up, down or sideways. typically, an upsloping flag you want to see on a down trending stock, and vice versa.
Wedge: Wedges are more traditional triangle shaped consolidations.
Ascending Triangle: Ascending triangles are similar to wedges, except pointed upwards. These triangles are bearish.
Descending triangle: the same as an ascending triangle, except flipped
Cup and Handle: A cup and handle is a top, a long curved bottom and then a wedge or flag on the other side. This can be seen in bearish or bullish charts.
Long Term Investing
Long term investing is the purchase of assets with the intention of holding them for greater time periods in seek of greater returns over time and through compounding:
Channels:
In trading discords, there are tons of different channels and avenues for communication. Below are the meanings of them:
#Announcements - Anything related to the discord and its upcoming events
#Trades - Where trades are posted, check the pinned messages for additional information
#Main - Primary chat room for conversation on the market and charts
#Ideas - A place for me to put all my ideas and additional trade ideas that don’t make the top cut for the main channel
#Resources - This is where you will find all of the videos and pdfs from past calls and articles ive written
That wraps up this tutorial and introduction to trading and investing.
If you enjoyed:
Follow my Twitter: HERE
Subscribe to my YouTube: HERE
If you’d like to level up your trading, DM me on discord or Twitter and we can setup a call.
subscribe to the newsletter at the button below:


